Common offences in the NSW Local Court: 2015
Introduction
This Sentencing Trends & Issues (the Trends) reports the sentences imposed in the Local Court of NSW (the court) for the most common offences in 2015. It also compares the findings with a similar study the Judicial Commission of NSW (the Commission) undertook in 2010.1 General findings about offender characteristics, the frequency with which statutory, regulatory and common law offences come before the court, and their classification under the Australian and New Zealand Standard Offence Classification (ANZSOC)2 are discussed.
Sentencing is a complex task requiring a process of "instinctive synthesis",3 by which all factors relevant to the sentence are identified and evaluated before a judgment is made as to the appropriate sentence having regard to all those circumstances.4 The relevant factors include the nature and number of offences, the objective seriousness or gravity of the offence(s) and the offender's subjective circumstances. The latter includes the offender's age, prior record, contrition and plea. There is no analysis in the Trends of the effect of objective and subjective factors on the sentences reported. Accordingly, a study of this kind cannot be used for comparative sentence purposes as that process is described by the High Court in Hili v The Queen,5 The Queen v Pham6 and The Queen v Kilic.7 The Trends is intended to inform by identifying the most common offences the court dealt with in 2015 and the sentences imposed.
Scope
Previous studies analysed offence and sentencing information by reference to the principal offence only, that is, the most severe sentence imposed in the sentencing exercise. The rationale for such an approach is obvious since the principal offence is generally the most serious. It is also the means by which analysis of individual offender characteristics is undertaken. However, that approach has limitations, including that it does not take account of the prevalence of the commission of a particular offence. Further, presenting and analysing sentences only for the principal offence may distort the range of sentences and use of particular penalties. Another limitation is that regard cannot be had to the impact of multiple offences on the sentencing exercise. This can have an effect in two ways. The first concerns whether the offences represent a course of conduct and whether the use of particular penalties changes as a result. The second concerns the impact of the application of the principle of totality. That principle requires a court sentencing an offender for multiple offences to ensure that the overall sentence is "just and appropriate" and reflects the totality of the conduct involved in the various offences.8 The sheer number of offences in some cases may be the court's rationale for imposing imprisonment (and all its forms) rather than the seriousness of the principal offence. Therefore, in addition to reporting the sentencing patterns for the 20 most common statutory principal offences, the Trends will include results of an analysis of all proven offences9 finalised in the court in 2015. The top 10 regulatory principal offences and their sentencing patterns will also be discussed briefly.
Data source and methodology
Sentencing data for the court are obtained from the JusticeLink System. The Bureau of Crime Statistics and Research (BOCSAR) processes and audits10 the data and supplies it to the Commission. The Commission uses the data for publications and to generate the statistics that appear on the Judicial Information Research System (JIRS).11
The Trends analyses sentencing data for first instance proven offences in finalised court appearances in the 2015 calendar year.12 The data have not been "corrected" to take into account the outcomes of subsequent successful conviction or sentence appeals to the District and Supreme courts.
The data exclude sentences imposed following breach proceedings13 but include penalties imposed where the offender made an election for the court to deal with a penalty infringement notice.
For analysis based on the principal offence, the principal offence is determined to be the offence which attracts the highest penalty in terms of type and quantum of sentence.14
The offences of "destroy or damage property" and "larceny" attract different jurisdictional maximums depending on the value of the property.15 All traffic offences analysed in the top 20 statutory principal offences may also attract higher penalties and licence disqualification periods16 if an offender is being sentenced for a second or subsequent offence (referred to for convenience as "subsequent offences").17 Where relevant, the Trends includes analysis of the penalties imposed for each subcategory.
For the offences of "common assault", "knowingly contravene AVO",18 "assault occasioning actual bodily harm", "stalk or intimidate with intent to cause fear of physical or mental harm" and "destroy or damage property", the Trends will also report the proportion committed in a domestic violence context19 and any statistically significant differences in the penalty distribution.20 These figures were calculated using a domestic-violence specific law part code created by the Commission for the police.21
Terminology
The term "median" refers to the sentence that lies in the middle of a range of values. "Mean" refers to the average value. The term "mode" indicates the most frequently occurring value or values. The percentages in parentheses following the mode indicate the proportion of offenders who were given that value for the penalty.
In respect of fines, the percentage of fines falling within the middle 50% range of values is shown. The lower limit of this range is set at the first quartile (or 25th percentile) and the upper limit is set at the third quartile (or 75th percentile). This range shows the spread of values near the centre.
The term "imprisonment" includes custodial sentences and suspended sentences. "Custodial sentences" include full-time imprisonment, home detention and intensive correction orders.21
In respect of full-time imprisonment, "full term" refers to the non-parole period (NPP) and the balance of the term of sentence or, where a s 53A aggregate sentence has been imposed, the indicative sentence for an offence.23 The "NPP/fixed term" refers to the period of time to be served in custody.24 The "overall full term" and "overall NPP" refer to the total sentence and NPP imposed in each case whether an offender committed one or more offences.
Cases involving multiple sentences of full-time imprisonment with a degree of accumulation between those sentences and where the overall full term or overall NPP exceeds the full term or NPP for the principal offence are referred to as "consecutive sentences".
The abbreviation "pu" refers to penalty units,25 and "pp" refers to percentage points.
Jurisdiction of the court
The court has jurisdiction to hear and determine two types of offences: summary offences and indictable offences capable of being dealt with summarily under Ch 5 of the Criminal Procedure Act 1986.26 Sections 267 and 268 of that Act set out the maximum penalties that can be imposed by the court when indictable offences are dealt with in this way. Those provisions "prescribe the jurisdictional limit of the Local Court and not the maximum penalty for any offence triable within that jurisdiction".27
The maximum penalty for an offence remains relevant to the sentencing exercise despite the court's jurisdictional limit. The jurisdictional maximum should not be regarded as a form of maximum penalty reserved for a worst case.28 The Court of Criminal Appeal remarked in R v Doan29 that a jurisdictional maximum is:
not a maximum penalty for any offence triable within that jurisdiction. In other words, where the maximum applicable penalty is lower because the charge has been prosecuted within the limited summary jurisdiction of the Local Court, that court should impose a penalty reflecting the objective seriousness of the offence, tempered if appropriate by subjective circumstances, taking care only not to exceed the maximum jurisdictional limit.30
This principle applies to a number of the 20 most common statutory principal offences including "assault occasioning actual bodily harm", "stalk or intimidate with intent to cause fear of physical or mental harm", "larceny", "destroy or damage property", "assault with intent on certain officers" and "fraud".
The maximum sentence of imprisonment the court can impose when sentencing for multiple offences is five years.31 When an offender is sentenced for more than one offence, the overall sentence must be "just and appropriate" and reflect the totality of the offending behaviour.32
Significant legislative amendments
Since 2010, there has been a range of legislative amendments affecting the Local Court's
jurisdiction.
Aggregate sentencing
Arguably the most significant amendment in terms of sentencing procedure occurred in 2011 when the statutory aggregate sentencing scheme was introduced.33 The aim of that scheme was to remove some of the complexity involved in applying the decision of Pearce v The Queen (1998) 194 CLR 610 when sentencing for multiple offences,34 and to modify the statutory requirement to nominate commencement and expiration dates for individual sentences of imprisonment. Section 53A was inserted into the Crimes (Sentencing Procedure) Act 1999 and enables a court, when sentencing for more than one offence, to impose an aggregate sentence of imprisonment rather than separate sentences with specific start and end dates for each offence.35 Section 53A(2) requires the court to indicate to the offender, and make a written record of, the fact an aggregate sentence is being imposed and the individual sentences which would have been imposed for each offence.36
During 2015, the Crimes (Sentencing Procedure) Act 1999 did not expressly provide that the Local Court's power to impose an aggregate sentence was limited to the five-year ceiling that applies when sentencing for multiple offences and there was some doubt as to whether the court's jurisdiction was so limited.37 This ambiguity was considered by the NSW Law Reform Commission in 201338 and resolved in 2016 by the insertion of s 53B into the Crimes (Sentencing Procedure) Act 1999. It makes clear that the same five-year limit applies to an aggregate sentence imposed by the Local Court under s 53A.39
Changes to jurisdictional maximums
The Courts and Crimes Legislation Amendment Act 2012 commenced on 21 March 2012 and increased the jurisdictional maximums applicable in the Local Court for a number of the offences discussed in the Trends. These have been noted where applicable. The effect of these amendments is that the jurisdictional maximum for all indictable offences dealt with summarily in the Local Court is now two years imprisonment. The amendment applies to offences committed on or after 21 March 2012.
Introduction of new fraud offences
New fraud offences commenced on 22 February 2010.40 These were modelled on the fraud offences in the Model Criminal Code and were intended to "harmonise New South Wales law with the national model scheme".41 As a result, the number of fraud offences under the Crimes Act 1900 was dramatically reduced, old and obsolete provisions were repealed and new identity theft offences were introduced. In particular, a broad offence of fraud under s 192E was inserted into the Act with the intention that it would cover a broad range of conduct previously dealt with under a number of specific offences.42
Road transport legislation
There were significant amendments to road transport legislation following the 2010 study. The Road Transport Act 2013 was introduced to consolidate provisions of four separate Acts.43 While these amendments affected all traffic offences reported in the Trends, the nature of the substantive offences and applicable maximum penalties did not change.
On 1 February 2015, a mandatory interlock program commenced,44 prescribing certain alcohol-related driving offences (PCA45)as "mandatory interlock offences". The program applies to offenders with a previous "alcohol-related major offence" and to all high-range PCA offenders.46 A court must make a mandatory interlock order47 or an interlock exemption order in relation to such offenders at the time of conviction.48 Offenders receiving mandatory interlock orders are subject to different minimum and maximum licence disqualification periods, in addition to the prescribed interlock period.49
General findings
In total, 120,288 offenders50 were sentenced in the court in 2015 for 217,185 offences, whether or not the offence was a principal offence. This includes 193,895 statutory (89.3%), 23,187 regulatory (10.7%) and 103 common law (0.05%) offences. The vast majority of offences were committed contrary to NSW law (96.7%); only 3.3% were committed contrary to Commonwealth legislation. Both the number of offenders and offences was less than in 2010.51
Appendix A shows the 217,185 offences broken down by ANZSOC division and subdivision. The most common subdivisions are also broken down by ANZSOC group. As in 2010, the ANZSOC division representing the greatest proportion of offences was "traffic and vehicle regulatory offences", accounting for 37.3% (80,979) of all proven offences. However, this represents a decrease of 6.3 pp from 2010, where "traffic and vehicle regulatory offences" accounted for 43.6% (95,611) of all proven offences. This was mostly attributable to a 4.7 pp decrease in the ANZSOC subdivision "regulatory driving offences" from 27.6% (60,455) of all proven offences in 2010 to 22.9% (49,788) in 2015. This was the largest change of any ANZSOC subdivision from 2010.
The next most common ANZSOC divisions were "acts intended to cause injury", accounting for 12.2% (26,448) of all proven offences (10.9% (23,923) of all proven offences in 2010), and "offences against justice procedures, government security and government operations", accounting for 11.2% (24,222) of all proven offences (8.5% (18,709) of all proven offences in 2010).
The ANZSOC division "illicit drug offences", the fourth most common, increased 3.5 pp from 2010 (6.1% (13,337)) to represent 9.6% (20,937) of all proven offences. Consistent with findings reported later in the Trends, the ANZSOC subdivision "possess and/or use illicit drugs" represented 8.3% (18,059) of all proven offences, an increase of 3.3 pp, the second largest change of any ANZSOC subdivision from 2010 (5.0% (10,876)).
Offender characteristics
Offender characteristics52 were largely similar to those reported in 2010. Any notable differences are discussed under the relevant characteristic.
Gender: Offenders sentenced in the court were predominantly male (79.8%), while 20.2% were female.53
Age: Themedian age of offenders at the time of offence was 32 years and the mean age was 34.7 years.54
Indigenous status: Offenders identified as Aboriginal and Torres Strait Islander persons in 14.1% of cases.55 While this represents an increase of 3.6 pp from 2010, this may be attributable to Indigenous status being known in a higher rate of cases.56
Court location: Over half of all cases were finalised in Sydney (57.2%); 9.6% were finalised in courts located in Newcastle or Wollongong; and the remaining 33.2% were finalised in courts located in regional NSW (a small increase of 2.2 pp).
Number of offences: Two-thirds of offenders (66.6%) were sentenced for one offence only, and one-third for multiple offences (33.4%): 17.6% were sentenced for two offences; 7.1% for three offences; 3.4% for four offences; and 5.4% for five or more offences.57
Plea: Just over three-quarters of offenders (76.5%) pleaded guilty.58
Prior record: Just over a third of offenders (36.7%) had no prior record of offending, while nearly two-thirds (63.3%) had a prior record: 23.4% had prior offences of a different type and 39.9% had prior offences of the same type.59 Overall, 17.3% of offenders had previously served a sentence of full-time imprisonment: 7.3% for an offence of the same type and 10.0% for an offence of a different type. The proportion of offenders with a prior record increased 7.8 pp from 2010, while the rate of offenders who had previously served a sentence of full-time imprisonment increased 5.1 pp from 2010.
Bail status at sentencing: In the majority of cases (74.6%) bail was not an issue.60 The offender was either on bail (15.8%) or in custody (9.7%, an increase of 3.5 pp)61 at the time of sentence in the remaining cases.
Penalties for statutory offences
The penalties available to the court are set out in Pt 2 of the Crimes (Sentencing Procedure) Act 1999. References to sections below are to provisions of that Act unless specified otherwise. Penalties imposed under the Act may be custodial or non-custodial. Custodial sentences include full-time imprisonment (ss 5, 44–46), home detention HD (s 6)62 and intensive correction orders (ICOs) (s 7).63 Non-custodial penalties include community service orders (CSOs) (s 8), good behaviour bonds (s 9), dismissal of charges and conditional discharge (s 10), conviction with no other penalty (s 10A) and suspended sentences (s 12).
Recognizance orders with or without conviction under the Crimes Act 1914 (Cth), ss 19B and 20 are included with comparable NSW provisions.64
Figure 1 shows the distribution of penalty types imposed on 105,203 offenders sentenced for statutory offences in 2015 (principal offence only).65 Penalty types are displayed on the x-axis (from least to most severe), and the rate with which the penalties were imposed is displayed on the y-axis. The following is a summary of these findings, with penalties discussed in order of frequency.
Figure 1: Distribution of penalty types for offenders sentenced for statutory offences in the NSW Local Court in 2015 (principal offences only)
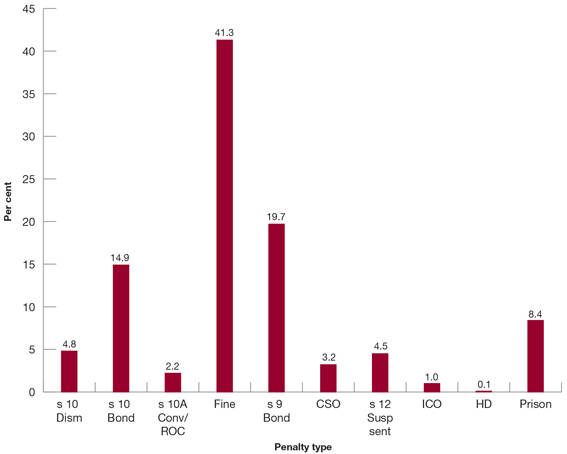
Fines were the most common penalty, imposed on 41.3% of offenders.66 This represents a slightly lower proportion of all penalties than in 2010 (43.7%) and continues the downward trend discussed in the previous study.67 The median fine was $500, as was the mode (imposed on 16.2% of offenders fined). These figures remain unchanged from 2010. The middle 50% range of fines was $330 to $800, accounting for 56.4% of fines. This was slightly higher than in 2010, where the middle 50% range was $300 to $700. Of the offenders convicted for a Commonwealth principal offence, 47.2% were fined. The median fine for Commonwealth offences was $1,000. Fines were imposed on 41.2% of NSW offenders. The median for NSW offences was $500. The mode for both Commonwealth and State fines was $500 (imposed on 14.2% of Commonwealth offenders and 16.2% of NSW offenders). The middle 50% range of Commonwealth fines was $500 to $2,000. For NSW fines, it was $330 to $800.68
Good behaviour bonds (s 9 bonds) were the next most common penalty, imposed on 19.7% of offenders.69 The use of this penalty is stable, with bonds imposed on 19.8% of offenders in 2010. The median bond duration was 12 months (equal to 2010), as was the mode (51.5%). The majority of bonds imposed (87.2%) were in the range of 12 to 24 months duration (similar to 86.0% in 2010). Commonwealth bonds tended to be longer with a median duration of 15 months (a decrease from 18 months in 2010) compared with 12 months for bonds imposed in respect of State offences. Overall, 66.8% of bonds were unsupervised (similar to 68.2% in 2010). Supervised bonds were generally longer (median 15 months, a decrease from 18 months in 2010) than unsupervised bonds (median 12 months).
Dismissals and discharges without conviction (s 10 orders) were imposed on 19.7% of offenders.70 This figure is comprised of 4.8% of offenders who had their charge dismissed unconditionally (s 10 dismissals)71 and 14.9% who were discharged without conviction on condition they enter into a good behaviour bond (s 10 bonds).72 The use of s 10 dismissals decreased slightly from 2010 (1.3 pp), while s 10 bonds increased (2.4 pp). Like 2010, the median duration of s 10 bonds was 12 months, as was the mode (50.5%).
Full-time imprisonment was imposed on 8.4% of offenders (an increase of 1.5 pp from 2010).73 The median full term imposed for the principal offence was 9 months (unchanged from 2010).74 Just over one-third of these offenders (37.1%) received one sentence of full-time imprisonment; close to two-thirds (62.9%) received multiple; 48.6% involved non-consecutive sentences; 14.3% involved consecutive sentences. An aggregate sentence under s 53A was imposed in 8.2% of cases involving multiple sentences of full-time imprisonment. The median overall full term was 10 months and the median overall NPP was 6 months.75 The frequency of special circumstances could be calculated either at the principal offence level or at the overall level.76 The latter calculation has been used, consistent with past studies. Special circumstances were found in 84.1% of cases. The most common ratios (between the overall NPP and overall full term) were 1:2 (or 50%), 2:3 (or 66.7%) and 1:3 (or 33.3%) (imposed in 18.8%, 11.1% and 9.2% of cases respectively). The median ratio was 1:2.
Suspended sentences (s 12) were imposed on 4.5% of offenders.77 While the use of this penalty gradually increased in previous studies,78 it has now slightly decreased from 2010 (down 0.3 pp). The median term was 9 months and the mode was 12 months (26.3%). Both the median and mode were unchanged from 2010. Similar to 2010, the median duration of Commonwealth suspended sentences was slightly longer (12 months, a decrease from 13 months in 2010) than NSW suspended sentences (9 months). Supervision was imposed in 57.8% of cases (an increase from 53.6% in 2010). There was no difference in duration between supervised and unsupervised suspended sentences.
Community service orders (CSOs) were imposed on 3.2% of offenders,79 a slight decrease of 0.7 pp in 2010. The median term of CSOs was 120 hours and the mode was 100 hours (23.2%), both remain unchanged from 2010. CSOs of 150 and 200 hours were also common (14.9% and 15.3% respectively), and the middle 50% range of CSO hours was 100 to 200, imposed on 62.2% of offenders.
Convictions recorded with no other penalty (s 10A convictions) were imposed on 2.2% of offenders. This includes 16 offenders (0.02%) sentenced to the rising of the court (ROC). In the Trends, both penalty types have been combined for the purpose of analysis.
Intensive correction orders (ICOs) were imposed on 1.0% of offenders.80 This penalty was available for only three months of the previous Trends period in 2010,81 and accordingly represented only 0.1% of penalties imposed in that study. The median duration of ICOs imposed in 2015 was 12 months (an increase from 10 months in 2010). The mode was also 12 months (26.7%), unchanged from 2010.
Home detention (HD) was imposed on 0.1% of offenders. The median full term was 12 months (an increase from 9 months in 2010) and the median NPP/fixed term was 8 months (an increase from 6 months in 2010).
Twenty most common statutory offences
Table 1 shows the 20 most common statutory offences (principal offence only) the court dealt with in 2015. These offences accounted for 73.2% of the total number of statutory principal offences finalised in 2015. The top 20 reported in 2010 accounted for 73.1%.82
Table 1: Most common proven statutory offences (principal offence only) sentenced in the NSW Local Court in 2015
| Rank 2015 | Rank 2010 | Offence description | Legislation | Number of cases | % of cases |
|---|---|---|---|---|---|
| 1 | 4 | Possess prohibited drug | Drug Misuse and Trafficking Act 1985, s 10(1) | 10,414 | 9.9 |
| 2 | 1 | Mid-range PCA | Road Transport Act 2013, s 110(4)a | 7.085 | 6.7 |
| 3 | 2 | Common assault | Crimes Act 1900, s 61 | 6,868 | 6.5 |
| 4 | 3 | Low-range PCA | Road Transport Act 2013, s 110(3)b | 6,338 | 6.0 |
| 5 | – | Drive with presence of prescribed illicit drug | Road Transport Act 2013, s 111(1)c | 4,952 | 4.7 |
| 6 | 5 | Drive while disqualified | Road Transport Act 2013, s 54(1)(a)d | 4,917 | 4.7 |
| 7 | 8 | Knowingly contravene AVO | Crimes (Domestic and Personal Violence) Act 2007, s 14(1) | 4,023 | 3.8 |
| 8 | 6 | Assault occasioning actual bodily harm | Crimes Act 1900, s 59(1) | 4,002 | 3.8 |
| 9 | 13 | Stalk or intimidate with intent to cause fear of physical or mental harm | Crimes (Domestic and Personal Violence) Act 2007, s 13(1) | 3,904 | 3.7 |
| 10 | 10 | Larceny | Crimes Act 1900, s 117 | 3,584 | 3.4 |
| 11 | 7 | Drive while suspended | Road Transport Act 2013, s 54(3)(a)e | 3,311 | 3.1 |
| 12 | 9 | Destroy or damage property | Crimes Act 1900, s 195(1)(a) | 3,126 | 3.0 |
| 13 | 11 | High-range PCA | Road Transport Act 2013, s 110(5)f | 2,717 | 2.6 |
| 14 | 12 | Never licensed person drive on road | Road Transport Act 2013, s 53(3)g | 2,555 | 2.4 |
| 15 | 19 | Goods in custody | Crimes Act 1900, s 527C(1) | 1,897 | 1.8 |
| 16 | 18 | Drive while suspended under s 66 of the Fines Act 1996 | Road Transport Act 2013, s 54(5)(a)(i)h | 1,810 | 1.7 |
| 17 | 15 | Drive without being licensed | Road Transport Act 2013, s 53(1)(a)i | 1,587 | 1.5 |
| 18 | 14 | Assault with intent on certain officers | Crimes Act 1900, s 58 | 1,569 | 1.5 |
| 19 | – | Fraud | Crimes Act 1900, s 192E(1)j | 1,397 | 1.3 |
| 20 | 20 | Special-range PCA | Road Transport Act 2013, s 110(2)k | 1,004 | 1.0 |
| Total for top 20 statutory offences | 77,060 | 73.2 | |||
| All remaining statutory offences | 28,184 | 26.8 | |||
| Total number of cases | 105,244 | 100.0 |
- This offence includes a small number of cases dealt with under the Road Transport (Safety and Traffic Management) Act 1999, s 9(3) (rep).
- This offence includes a small number of cases dealt with under the Road Transport (Safety and Traffic Management) Act 1999, s 9(2) (rep).
- This offence includes a small number of cases dealt with under the Road Transport (Safety and Traffic Management) Act 1999, s 11B(1) (rep).
- This offence includes a small number of cases dealt with under the Road Transport (Driver Licensing) Act 1998, s 25A(1)(a) (rep).
- This offence includes a small number of cases dealt with under the Road Transport (Driver Licensing) Act 1998, s 25A(2)(a) (rep).
- This offence includes a small number of cases dealt with under the Road Transport (Safety and Traffic Management) Act 1999, s 9(4) (rep).
- This offence includes a small number of cases dealt with under the Road Transport (Driver Licensing) Act 1998, s 25(2) (rep).
- This offence includes a small number of cases dealt with under the Road Transport (Driver Licensing) Act 1998, s 25A(3A)(a)(i) (rep).
- This offence includes a small number of cases dealt with under the Road Transport (Driver Licensing) Act 1998, s 25(1)(a) (rep).
- This offence includes a small number of cases dealt with under the Crimes Act 1900, ss 178A, 178BA(1),178C (all rep).
- This offence includes a small number of cases dealt with under the Road Transport (Safety and Traffic Management) Act 1999, s 9(1) (rep).
Table 2: Distribution of penalty types for the most common proven statutory offences (principal offence (only) in the NSW Local Court in 2015
|
Principal penalty type (%) |
|||||||||||
|
Rank |
Offence description |
s 10 Dism |
s 10 Bond |
s 10A Conv/ROC |
Fine |
s 9 Bond |
CSO |
s 12 Susp sent |
ICO |
HD |
Prison |
|
1 |
Possess prohibited drug |
8.1 |
18.7 |
3.2 |
56.9 |
9.9 |
0.3 |
0.7 |
0.1 |
0.0 |
2.1 |
|
2 |
Mid-range PCA |
0.3 |
15.2 |
0.7 |
61.8 |
15.6 |
3.0 |
2.0 |
0.7 |
0.1 |
0.8 |
|
3 |
Common assault |
3.4 |
23.7 |
0.7 |
15.5 |
41.5 |
3.5 |
4.8 |
0.7 |
0.0 |
6.3 |
|
4 |
Low-range PCA |
4.8 |
45.5 |
0.5 |
48.8 |
0.4 |
<0.05 |
No term of imprisonment available |
|||
|
5 |
Drive with presence of prescribed illicit drug |
3.6 |
28.4 |
2.0 |
65.3 |
0.7 |
<0.05 |
No term of imprisonment available |
|||
|
6 |
Drive while disqualified |
0.8 |
5.3 |
1.0 |
25.2 |
23.5 |
10.6 |
12.8 |
4.1 |
0.9 |
15.9 |
|
7 |
Knowingly contravene AVO |
3.0 |
6.2 |
5.7 |
16.2 |
38.9 |
3.5 |
8.4 |
1.1 |
0.0 |
16.9 |
|
8 |
Assault occasioning actual bodily harm |
0.8 |
8.3 |
0.1 |
5.4 |
40.8 |
7.7 |
12.4 |
3.3 |
n/a |
21.0 |
|
9 |
Stalk or intimidate with intent to cause fear of physical or mental harm |
0.9 |
10.6 |
0.8 |
8.5 |
51.0 |
3.6 |
8.1 |
0.9 |
n/a |
15.6 |
|
10 |
Larceny |
2.2 |
8.1 |
2.5 |
36.1 |
24.7 |
3.0 |
5.7 |
0.6 |
0.1 |
16.9 |
|
11 |
Drive while suspended |
3.4 |
25.9 |
1.6 |
58.1 |
8.0 |
1.4 |
0.8 |
0.2 |
0.1 |
0.7 |
|
12 |
Destroy or damage property |
3.7 |
19.2 |
2.9 |
36.4 |
27.6 |
2.0 |
2.2 |
0.4 |
0.0 |
5.6 |
|
13 |
High-range PCA |
<0.05 |
1.3 |
0.6 |
31.8 |
32.1 |
11.8 |
11.3 |
4.4 |
1.0 |
5.8 |
|
14 |
Never licensed person drive on road |
12.4 |
9.7 |
3.1 |
70.3 |
3.5 |
0.4 |
0.2 |
<0.05 |
0.0 |
0.4 |
|
15 |
Goods in custody |
1.0 |
5.0 |
3.0 |
38.9 |
30.3 |
1.6 |
3.5 |
0.3 |
0.1 |
16.3 |
|
16 |
Drive while suspended under s 66 of the Fines Act 1996 |
12.4 |
23.9 |
1.5 |
59.7 |
1.8 |
0.3 |
0.0 |
0.1 |
0.0 |
0.4 |
|
17 |
Drive without being licensed |
13.3 |
6.8 |
3.6 |
75.8 |
0.4 |
0.0 |
No term of imprisonment available |
|||
|
18 |
Assault with intent on certain officers |
1.3 |
10.8 |
1.0 |
21.4 |
40.1 |
5.3 |
5.4 |
0.8 |
0.1 |
13.8 |
|
19 |
Fraud |
0.8 |
6.1 |
1.4 |
19.3 |
32.3 |
7.2 |
8.6 |
2.6 |
0.8 |
21.0 |
|
20 |
Special-range PCA |
2.6 |
32.7 |
1.7 |
62.5 |
0.4 |
0.1 |
No term of imprisonment available | |||
|
All remaining statutory offences |
7.6 |
8.0 |
3.1 |
42.9 |
16.3 |
3.4 |
5.3 |
1.2 |
0.1 |
12.3 |
|
|
Total for all statutory offences |
4.8 |
14.9 |
2.2 |
41.3 |
19.7 |
3.2 |
4.5 |
1.0 |
0.1 |
8.4 |
|
|
Total number of cases |
5,072 |
15,680 |
2,272 |
43,428 |
20,673 |
3,325 |
4,688 |
1,058 |
128 |
8,879 |
|
Note: The figures highlighted show the highest rates for each penalty type.
Distribution of the most common offences
The 20 most common statutory principal offences largely resembled those for 2010. Eighteen offences previously appeared in the 2010 list. The two new offences with their rankings in parentheses were:
- (5) "Drive with presence of prescribed illicit drug": Road Transport Act 2013, s 111(1)
- (19) "Fraud": Crimes Act 1900, s 192E(1).
The two offences not in the list were (with their 2010 rankings in parentheses):
- (17) "Drive unregistered vehicle": Road Transport (Vehicle Registration) Act 1997, s 18(1) (rep), now Road Transport Act 2013, s 68(1)
- (16) "Negligent driving (not causing death or GBH)": Road Transport (Safety and Traffic Management) Act 1999, s 42(1)(c) (rep), now Road Transport Act 2013, s 117(1)(c).
Only two offences appearing in the list, "larceny" and "special-range PCA" held the same position as in 2010. Four of the five most common offences in 2015 were also in the top five in 2010.
The offence "possess prohibited drug" continued the upward trend reported previously and is now the first ranked offence, representing 9.9% of cases. This offence was ranked fourth in 2010 and sixth in 2007 (representing 6.3% and 4.5% of cases respectively).83
The number of offences under the Crimes (Domestic and Personal Violence) Act 2007 increased. "Knowingly contravene AVO" moved from eighth in 2010 (representing 3.6% of cases) to seventh (representing 3.8% of cases) while "stalk or intimidate with intent to cause fear of physical or mental harm" also increased from 13th in 2010 (representing 2.2% of cases) to ninth (representing 3.8% of cases).
"Goods in custody" moved from 19th in 2010 (representing 1.3% of cases) to 15th (representing 1.8% of cases).
Each of the three assault-related offences appearing in the list fell in ranking from 2010: "common assault" from second (representing 7.2% of cases in 2010) to third (representing 6.5% of cases), "assault occasioning actual bodily harm" from sixth (representing 4.2% of cases in 2010) to eighth (representing 3.8% of cases), and "assault with intent on certain officers" from 14th (representing 2.1% of cases in 2010) to 18th (representing 1.5% of cases).
The offence of "fraud" did not appear in the 2010 study.84 The movement of the offence into the list (representing 1.3% of cases) reflects evidence that fraud has increased since the previous study.85
As in previous studies, traffic offences continued to dominate the top 20 statutory principal offences. The offence "drive with presence of prescribed illicit drug" was fifth (representing 4.7% of cases).86 Its appearance in the list for the first time reflects the sharp upward trend of this offence observed in BOCSAR statistics,87 and is likely attributable to an increase in the availability and incidence of roadside testing technology.88 The number of offenders sentenced for the offence of "drive while suspended under s 66 of the Fines Act 1996" increased, moving from 18th in 2010 (representing 1.4% of cases) to 16th (representing 1.7% of cases). The ranking for the offence of "special-range PCA" was unchanged from 2010 (20th in both). There was a decrease in the number of offenders sentenced for all other traffic offences listed in the top 20. For example, "mid-range PCA" the most common offence in 2010 (representing 9.5% of cases) and in the two preceding study periods,89 is now ranked second (representing 6.7% of cases).
Penalties for the most common offences
Table 2 shows the penalty distribution for the 20 most common statutory offences (principal offence only) in 2015. When sentencing offenders, a number of factors relating to the offender and the offence must be taken into account, including their prior record, the number of offences and the plea. The following penalty information does not differentiate between those factors. The sentencing patterns for each of the top 20 statutory principal offences are discussed below, listed in order of their rankings as at 2015 in Table 1.
1. Possess prohibited drug
Drug Misuse and Trafficking Act 1985, s 10(1).
Maximum penalty: 2 yrs and/or 20 pu.
Sentences
- fines (56.9%): the median fine was $400; the mode was $500 (16.2%); other common fine amounts were $300 (12.9%), $400 (12.5%) and $200 (11.3%); 53.5% of fines were in the middle 50% range of $250–$500
- s 10 bonds (18.7%): the median duration was 12 months
- s 9 bonds (9.9%): 48.3% were supervised; the median was 12 months duration, as was the mode (61.0%)
- s 10 dismissals (8.1%)
- s 10A convictions/ROC90 (3.2%)
- full-time imprisonment (2.1%): the median full term and median NPP/fixed term was 2 months
- suspended sentences (0.7%), CSOs (0.3%), ICOs (0.1%)
The distribution of penalties for this offence was quite similar to 2010. Small decreases in the use of fines (1.9 pp), s 10 dismissals (0.7 pp) and s 10A convictions (0.5 pp) were offset by increases in the use of full-time imprisonment (0.7 pp), s 9 bonds (1.1 pp) and s 10 bonds (1.4 pp).
The severity of penalties imposed has remained largely stable. The median duration of s 9 and s 10 bonds was unchanged from 2010, as was the median full term of full-time imprisonment (which was the lowest of the offences in the list). The median fine increased by $100 from 2010, but remained the lowest median fine of the offences in this list (together with "special-range PCA").
Drug type
The distribution of drug types possessed by offenders91 sentenced for this offence was different to that observed in 2010. Although cannabis remained the most commonly possessed drug (46.0%) it decreased by 10.0 pp from 2010. The second most common was amphetamines (24.4%) which increased 10.6 pp from 2010. Cocaine (6.9%) increased by 1.9 pp but ecstasy (16.0%) and heroin (4.9%) decreased slightly by 1.3 pp and 1.0 pp respectively.
As was the case in 2010, the possession of heroin was more likely to attract full-time imprisonment (8.3%) or a s 9 bond (21.0%) than any other type of drug. Ecstasy attracted the highest rate of s 10 bonds and s 10 dismissals (52.3% and 17.4% respectively). Offences involving hallucinogens or cocaine also attracted a high rate of s 10 bonds (52.2% and 47.1% respectively). Possession of cannabis or amphetamines attracted the highest rate of fines (68.7% and 62.8% respectively).
For drug types in respect of which five or more offenders were sentenced to full-time imprisonment (heroin, cannabis, amphetamines and ecstasy), the median full term was 2 months, irrespective of the drug type.
Amphetamines and cocaine attracted the highest median fines ($500), while ecstasy and cannabis attracted the lowest ($330). The median fine for all other drug types was $400, equal to the overall median.
2. Mid-range PCA
Road Transport Act 2013, s 110(4).
Maximum penalty: 9 mths and/or 20 pu (first offence); 12 mths and/or 30 pu (subsequent offence).
Licence disqualification: automatic 12 mths, minimum 6 mths92 (no previous major offence); automatic 3 yrs, minimum 12 mths (previous major offence).93
Mandatory interlock:94 minimum licence disqualification period 6 mths, maximum 9 mths; minimum interlock period 24 mths.
Sentences
- fines (61.8%): the median fine was $750; the mode was $800 (14.9%); other common fine amounts were $600 (12.7%), $1,000 (11.8%) and $500 (10.4%); 54.7% of fines were in the middle 50% range of $600– $900
- s 9 bonds (15.6%): 20.7% were supervised; the median duration was 12 months
- s 10 bonds (15.2%): the median duration was 12 months
- CSOs (3.0%): the median term was 100 hours
- suspended sentences (2.0%): 58.9% were supervised; the median term was 8 months
- full-time imprisonment (0.8%), s 10A convictions (0.7%), ICOs (0.7%), s 10 dismissals (0.3%), HD (0.1%)
There were slight changes in the distribution of penalties for this offence from 2010. The use of fines decreased 5.8 pp, offset by increases in the use of s 9 and s 10 bonds (by 2.9 pp and 1.7 pp respectively). The proportion of supervised s 9 bonds decreased 8.9 pp while the proportion of supervised suspended sentences increased 8.5 pp. The median fine amount increased slightly ($700 in 2010) but the median duration of both s 9 and s 10 bonds was unchanged. The rate of CSOs was 0.5 pp higher than in 2010, although the median term decreased from 120 hours.
First and subsequent offences
First offences accounted for 86.6% of instances of this offence.95 Table 3 shows the distribution of penalty types for traffic offences broken down by first and subsequent offences. It can be seen that the rate of fines for subsequent offences was nearly half that for first offences (33.7% and 66.1% respectively). The median fine for a first offence was $750, but increased to $800 if the offence was a subsequent offence. The rates of s 9 bonds, CSOs and suspended sentences were higher for subsequent offences (35.1%, 12.2% and 8.7% respectively compared with 12.5%, 1.6% and 0.9% respectively for first offences), but was much lower for s 10 bonds (2.4% compared with 17.2% for first offences). The majority (66.1%) of offenders sentenced to imprisonment were subsequent offenders.
Table 3: Penalties for traffic offences — first and subsequent offence in the NSW Local Court in 2015
|
Principal penalty type |
Licence disqualification |
||||||||||||||||
|
Rank |
Offence |
Number of offencesa |
s 10 |
s 10 |
s 10A |
Fine |
s 9 |
CSO |
s 12 |
ICO |
HD |
Prison |
|||||
|
% |
% |
% |
% |
Median |
% |
Median |
% |
% |
% |
% |
% |
Median |
% |
Median |
2 |
Mid-range PCA |
|
|
First offence |
6,122 |
0.3 |
17.2 |
0.8 |
66.1 |
$750 |
12.5 |
12 mths |
1.6 |
0.9 |
0.3 |
<0.05 |
0.3 |
8 mths |
82.6 |
6 mths |
|
|
Subsequent offence |
944 |
0.1 |
2.4 |
0.4 |
33.7 |
$800 |
35.1 |
12 mths |
12.2 |
8.7 |
3.2 |
0.3 |
3.9 |
9 mths |
97.5 |
9 mths |
|
|
4 |
Low-range PCA |
||||||||||||||||
|
First offence |
5,776 |
5.2 |
49.2 |
0.5 |
44.8 |
$500 |
0.3 |
12 mths |
<0.05 |
No term of imprisonment available |
45.6 |
3 mths |
|||||
|
Subsequent offence |
559 |
0.0 |
7.5 |
0.5 |
90.2 |
$600 |
1.6 |
12 mths |
0.2 |
92.5 |
3 mths |
||||||
|
5 |
Drive with presence of prescribed illicit drug |
||||||||||||||||
|
First offence |
4,576 |
3.9 |
30.2 |
1.9 |
63.5 |
$400 |
0.6 |
12 mths |
0.0 |
No term of imprisonment available |
65.9 |
3 mths |
|||||
|
Subsequent offence |
376 |
0.0 |
6.4 |
3.7 |
87.2 |
$550 |
2.4 |
9 mths |
0.3 |
93.6 |
6 mths |
||||||
|
6 |
Drive while disqualified |
||||||||||||||||
|
First offence |
2,044 |
1.3 |
7.0 |
1.3 |
38.9 |
$800 |
27.9 |
12 mths |
8.4 |
7.5 |
1.5 |
0.1 |
6.1 |
8 mths |
91.7 |
24 mths |
|
|
Subsequent offence |
2,808 |
0.4 |
4.0 |
0.6 |
15.2 |
$900 |
20.4 |
15 mths |
12.2 |
16.7 |
6.0 |
1.4 |
23.1 |
12 mths |
95.5 |
24 mths |
|
|
11 |
Drive while suspended |
||||||||||||||||
|
First offence |
2,990 |
3.7 |
27.3 |
1.7 |
58.6 |
$600 |
6.8 |
12 mths |
0.9 |
0.5 |
0.1 |
0.1 |
0.4 |
12 mths |
69.0 |
12 mths |
|
|
Subsequent offence |
315 |
0.6 |
12.4 |
1.0 |
54.3 |
$700 |
18.4 |
12 mths |
5.7 |
3.5 |
0.6 |
0.0 |
3.5 |
6 mths |
87.0 |
24 mths |
|
|
13 |
High-range PCA |
||||||||||||||||
|
First offence |
2,253 |
<0.05 |
1.6 |
0.7 |
36.9 |
$1,000 |
33.6 |
15 mths |
11.3 |
9.3 |
2.6 |
0.7 |
3.3 |
12 mths |
98.4 |
18 mths |
|
|
Subsequent offence |
445 |
0.0 |
0.0 |
0.0 |
6.5 |
$1,200 |
24.7 |
24 mths |
14.4 |
20.7 |
13.5 |
2.2 |
18.0 |
12 mths |
100.0 |
24 mths |
|
|
14 |
Never licensed person drive on road |
||||||||||||||||
|
First offence |
1,750 |
16.2 |
9.4 |
3.2 |
70.7 |
$450 |
0.5 |
12 mths |
0.0 |
No term of imprisonment available |
7.6 |
6 mths |
|||||
|
Subsequent offence |
805 |
4.0 |
10.3 |
2.7 |
69.4 |
$600 |
10.2 |
12 mths |
1.2 |
0.7 |
0.1 |
0.0 |
1.2 |
7 mths |
85.8 |
36 mths |
|
|
16 |
Drive while suspended under s 66 of the Fines Act 1996 |
||||||||||||||||
|
First offence |
1,687 |
12.9 |
24.3 |
1.4 |
59.2 |
$500 |
1.7 |
12 mths |
0.2 |
0.0 |
0.1 |
0.0 |
0.3 |
2 mths |
62.8 |
3 mths |
|
|
Subsequent offence |
123 |
5.7 |
18.7 |
3.3 |
66.7 |
$600 |
2.4 |
12 mths |
1.6 |
0.0 |
0.0 |
0.0 |
1.6 |
* |
75.6 |
24 mths |
|
|
17 |
Drive without being licensed |
||||||||||||||||
|
First offence |
1,259 |
15.8 |
7.8 |
3.8 |
72.5 |
$400 |
0.1 |
* |
0.0 |
No term of imprisonment available |
7.9 |
6 mths |
|||||
|
Subsequent offence |
324 |
3.4 |
3.1 |
2.8 |
88.9 |
$500 |
1.9 |
12 mths |
0.0 |
41.0 |
12 mths |
||||||
|
20 |
Special-range PCA |
||||||||||||||||
|
First offence |
908 |
2.8 |
35.2 |
1.7 |
59.8 |
$400 |
0.4 |
* |
0.1 |
No term of imprisonment available |
62.0 |
3 mths |
|||||
|
Subsequent offence |
95 |
1.1 |
8.4 |
2.1 |
88.4 |
$500 |
0.0 |
– |
0.0 |
90.5 |
6 mths | ||||||
a Excludes the small number of cases dealt with under repealed legislation where it was not known that the offence was a first or subsequent offence.
* Denotes an insufficient number of cases to derive a valid median.
Licence disqualification and mandatory interlock program
The overwhelming majority (84.6%) of offenders received licence disqualifications. The median disqualification period was 6 months, slightly less than in 2010 (7 months). The median disqualification period differed depending on whether the offence involved was a first or subsequent offence (6 months compared with 9 months).96 For subsequent offences committed after 1 February 2015, 74.3% of offenders received licence disqualifications between 6 and 9 months, suggesting they may have been subject to mandatory interlock orders.
3. Common assault
Crimes Act 1900, s 61.
Maximum penalty: 2 yrs.
Jurisdictional maximum in Local Court: increased in 2012 to 2 yrs and/or 50 pu.97
Sentences
- s 9 bonds (41.5%): 30.3% were supervised; the median duration was 12 months
- s 10 bonds (23.7%): the median duration was 12 months
- fines (15.5%): the median fine was $600; the mode was $500 (18.0%); other common fine amounts were $1,000 (14.1%) and $600 (11.5%); 51.4% of fines were in the middle 50% range of $450–$880
- full-time imprisonment (6.3%): the median full term was 7 months; the median NPP/fixed term was 4 months
- suspended sentences (4.8%): 65.7% were supervised; the median term was 9 months
- CSOs (3.5%): the median term was 100 hours
- s 10 dismissals (3.4%)
- ICOs (0.7%), s 10A convictions (0.7%)
This offence had the second highest rate of s 9 bonds of the offences in the list. The distribution of penalties has remained largely unchanged since 2010. The use of fines decreased 3.5 pp but this was offset by small increases in the rates of other penalties, particularly s 9 bonds (1.5 pp), s 10 bonds (1.1 pp) and CSOs (1.0 pp).
There were slight increases in the severity of some penalties compared with those reported in 2010. The median fine increased from $500. The median term of suspended sentences and full term of full-time imprisonment each increased by 1 month.
Comparisons with sentences for this offence reported in the previous study should be approached cautiously given the increase to the jurisdictional maximum.
Domestic violence
Almost two-thirds (61.5%) of instances of this offence were recorded as having been committed in a domestic violence context. There was no statistically significant difference in the distribution of penalties.
4. Low-range PCA
Road Transport Act 2013, s 110(3).
Maximum penalty: 10 pu (first offence); 20 pu (subsequent offence).
Licence disqualification: automatic 6 mths, minimum 3 mths98 (no previous major offence); automatic 12 mths, minimum 6 mths (previous major offence).99
Mandatory interlock:100 minimum licence disqualification period 1 mth, maximum 3 mths; minimum interlock period 12 mths.
Sentences
- fines (48.8%): the median fine was $500; the mode was $500 (22.3%); other common fine amounts were $400 (15.3%) and $600 (13.5%); 56.7% of fines were in the middle 50% range of $400–$600
- s 10 bonds (45.5%): the median duration was 12 months
- s 10 dismissals (4.8%)
- s 10A convictions (0.5%), s 9 bonds (0.4%), CSOs (0.03%)
The penalties observed for this offence were more lenient than those imposed in 2010. The rate of s 10 bonds remained the highest of offences in the list; but was 10.7 pp higher than 2010. However, the median duration of these bonds remained unchanged. The increase in the use of s 10 bonds was offset by decreases in the rate of fines and s 10 dismissals (by 7.6 pp and 2.7 pp respectively). The median fine increased from $450 in 2010.
First and subsequent offences
First offences represented 91.2% of offences. As Table 3 shows, offenders who committed a subsequent offence were far more likely to receive a fine (90.2% compared with 44.8% for first offences) and less likely to receive a s 10 dismissal or s 10 bond (0.0% and 7.5% compared with 5.2% and 49.2% respectively). The median fine was higher for subsequent offences ($600 compared with $500).
Licence disqualification and mandatory interlock program
Just under half (49.7%) of offenders received licence disqualifications, a decrease of 8.4 pp from 2010. The median disqualification period was 3 months, unchanged from 2010. Subsequent offenders were more likely to be disqualified (92.5% compared with 45.6% for first offences), although there was no difference between the median disqualification periods ordered with respect to first and subsequent offences. For subsequent offences committed on or after 1 February 2015, 71.5% of offenders received licence disqualifications between 1 and 3 months, suggesting they may have been subject to a mandatory interlock order.
5. Drive with presence of prescribed illicit drug
Road Transport Act 2013, s 111(1).
Maximum penalty: 10 pu (first offence); 20 pu (subsequent offence).
Licence disqualification: automatic 6 mths, minimum 3 mths110 (no previous major offence); automatic 12 mths, minimum 6 mths (previous major offence).102
Sentences
- fines (65.3%): the median fine was $440; the mode was $400 (17.7%); other common fine amounts were $500 (16.4%) and $300 (14.9%); 69.4% of fines imposed were in the middle 50% range of $300–$600
- s 10 bonds (28.4%): the median duration was 12 months
- s 10 dismissals (3.6%)
- s 10A convictions (2.0%)
- s 9 bonds (0.7%), CSOs (0.02%)
This offence has not previously appeared in a study of this kind undertaken by the Commission. It had the third highest rate of both fines and s 10 bonds of the offences in the list. Although the same maximum penalties and automatic disqualification periods apply as for "low-range PCA", the penalties imposed for this offence were more severe, with higher rates of fines and lower rates of s 10 bonds and s 10 dismissals. However, the median fine and middle 50% range of fines were lower than for "low-range PCA".
First and subsequent offences
The vast majority (92.4%) were first offences. As Table 3 shows, those offenders who committed subsequent offences were less likely to receive a s 10 dismissal (0.0% compared with 3.9% for first offences) or a s 10 bond (6.4% compared with 30.2%). The median fine was higher for subsequent offences ($550 compared with $400).
Licence disqualification
Over two-thirds (68.0%) of offenders were disqualified from holding a driver's licence. Table 3 shows that the rate of licence disqualification was higher if the offender committed a subsequent offence (93.6% compared with 65.9% for first offences). The median disqualification period was 4 months. When broken down into first and subsequent offences the median disqualification periods were 3 months and 6 months respectively (each equal to the respective minimum disqualification periods).
6. Drive while disqualified
Road Transport Act 2013, s 54(1)(a).
Maximum penalty: 18 mths and/or 30 pu (first offence) [automatic licence disqualification 12 mths]; 2 yrs and/or 50 pu (subsequent offence) [automatic disqualification 2 yrs].
Sentences
- fines (25.2%): the median fine was $825; the mode was $1,000 (20.7%); other common fine amounts were $500 (12.9%) and $1,500 (9.9%); 51.4% of fines were in the middle 50% range of $600–$1,000
- s 9 bonds (23.5%): 18.0% were supervised; the median duration was 12 months
- full-time imprisonment (15.9%): the median full term was 11 months; the median NPP/fixed term was 6 months
- suspended sentences (12.8%): 33.4% supervised; the median term was 9 months
- CSOs (10.6%): the median term was 120 hours
- s 10 bonds (5.3%): the median duration was 12 months
- ICOs (4.1%): the median term was 12 months
- s 10A convictions (1.0%), HD (0.9%), s 10 dismissals (0.8%)
There were slight changes in the distribution of penalties for this offence compared to 2010. As observed then, this offence consistently has a high rate of custodial sentences relative to other traffic offences in the list with the same maximum penalty.103 It had the third highest rate of custodial sentences (20.9%), including the highest rate of HD and the second highest rate of ICOs of the offences in the list. It also had the highest rate of suspended sentences and the second highest rate of CSOs. Rates of fines and full-time imprisonment increased from 2010 (by 4.2 pp and 1.7 pp respectively) while rates of suspended sentences and CSOs decreased (by 3.2 pp and 5.6 pp respectively).
Changes in the severity of penalties were mixed. The median durations of s 9 and s 10 bonds were less than those reported in 2010 (where the medians were 18 months and 15.5 months respectively). However, there were increases in the medians for the full term of full-time imprisonment (9 months in 2010), CSOs (100 hours in 2010) and fines ($750 in 2010). The median fine for this offence increased by $75 and was the third highest of the offences in the list (after "high-range PCA" and "assault occasioning actual bodily harm").
First and subsequent offences
The severity of penalties imposed for this offence is likely explained by the fact it is the only traffic offence in the list for which the majority of offences were subsequent offences (57.9%). As can be seen in Table 3, of those offenders nearly half (47.2%) were sentenced to imprisonment, with 23.1% sentenced to full-time imprisonment. By comparison, 15.2% of offenders sentenced for a first offence received a term of imprisonment with 6.1% sentenced to full-time imprisonment. The median full term of full-time imprisonment was also higher for subsequent offences (12 months compared with 8 months for first offences).
Licence disqualification
The vast majority of offenders (93.9%) were disqualified from holding a driver's licence (down 0.6 pp from 2010). The median and mode disqualification periods were 24 months (80.1%). The next most common disqualification period was 12 months (17.6%). These figures were similar to those observed in 2010. When broken down between first and subsequent offences, the median disqualification period in both categories was 24 months.
7. Knowingly contravene AVO
Crimes (Domestic and Personal Violence) Act 2007, s 14(1).
Maximum penalty: 2 yrs and/or 50 pu.
Sentences
- s 9 bonds (38.9%): 39.4% were supervised; the median duration was 12 months
- full-time imprisonment (16.9%): the median full term was 8 months; the median NPP/fixed term was 4 months
- fines (16.2%): the median fine was $500; the mode was $500 (21.4%); the next most common fine amount was $300 (12.9%); 55.0% of fines were in the middle 50% range of $300–$600
- suspended sentences (8.4%): 67.8% were supervised; the median term was 9 months
- s 10 bonds (6.2%): the median duration was 12 months
- s 10A convictions/ROC104 (5.7%)
- CSOs (3.5%): the median term was 100 hours
- s 10 dismissals (3.0%)
- ICOs (1.1%): the median term was 9 months
Penalties for this offence were generally more severe in 2015 than in 2010. While the use of s 10A convictions and s 9 bonds increased (by 0.8 pp and 3.3 pp respectively), the rate of all other non-custodial penalties decreased. The rate of s 10A convictions was the highest of the offences in the list.
If the act constituting the offence was an act of violence against a person, s 14(4) of the Crimes (Domestic and Personal Violence) Act 2007 provides that unless the court otherwise orders, a person convicted of an offence under this section must be sentenced to a term of imprisonment. Terms of imprisonment were imposed on 26.4% of offenders (2.7 pp increase from 2010). Most were terms of full-time imprisonment (16.9%, up 2.4 pp from 2010). Together with "larceny", the rate of full-time imprisonment was the third highest of the offences in the list.
In terms of severity of penalties, the median term of CSOs and the median duration of s 9 and s 10 bonds remained the same. However, the median fine increased by $100. The median full term of full-time imprisonment increased by 2 months while the NPP/fixed term increased by 1 month. The median term of suspended sentences increased by 1 month. The proportion of supervised suspended sentences increased by 8.6 pp from 2010.
Domestic violence
Most instances of this offence (94.4%) were recorded as having been committed in a domestic violence context. A statistically significant difference was found in the distribution of penalties. Domestic violence offences attracted higher rates of full-time imprisonment (17.4% compared with 9.7% of non-domestic violence offences) and lower rates of s 10 orders (9.0% compared with 14.1%).
8. Assault occasioning actual bodily harm
Crimes Act 1900, s 59(1).
Maximum penalty: 5 yrs.
Jurisdictional maximum in Local Court: 2 yrs and/or 50 pu.
Sentences
- s 9 bonds (40.8%): 35.0% were supervised; the median duration was 15 months
- full-time imprisonment (21.0%): the median full term was 12 months; the median NPP/fixed term was 6 months
- suspended sentences (12.4%): 68.1% were supervised; the median duration was 12 months
- s 10 bonds (8.3%): the median duration was 12 months
- CSOs (7.7%): the median term was 150 hours
- fines (5.4%): the median fine was $900; the mode was $1,000 (20.6%); other common fine amounts were $500 (13.3%), $1,500 (10.6%) and $800 (10.1%); 55.5% of fines were in the middle 50% range of $600–$1,200
- ICOs (3.3%): the median term was 12 months
- s 10 dismissals (0.8%), s 10A convictions/ROC105 (0.1%)
The distribution of penalties for this offence was more severe than that reported in 2010, with a 9.0 pp increase in sentences of imprisonment (36.7% compared with 27.7% in 2010), the highest rate of imprisonment of offences in the list. In particular, the rate of full-time imprisonment increased by 5.1 pp. Together with "fraud", this offence had the highest rate of full-time imprisonment. It had the second highest rate of suspended sentences (an increase of 1.5 pp from 2010) and the third highest rate of ICOs. There were decreases from 2010 in the rates of s 9 bonds (5.3 pp), fines (3.0 pp), and s 10 bonds (1.5 pp). As in 2010, this offence had the lowest rate of fines of the offences in the list.
In terms of the severity of particular penalties, the median full term of full-time imprisonment (12 months) was unchanged from 2010 and, together with "high-range PCA", was the highest in the list. The median duration of suspended sentences increased by 2 months from 2010 and was also the highest of the offences in the list. The median fine amount also increased (by $200), while the mode ($1,000) was double that reported in 2010.
Domestic violence
The offence was recorded as having been committed in a domestic violence context in close to two-thirds (60.1%) of offences. There was no statistically significant difference in the distribution of penalties.
9. Stalk or intimidate with intent to cause fear of physical or mental harm
Crimes (Domestic and Personal Violence) Act 2007, s 13(1).
Maximum penalty: 5 yrs and/or 50 pu.
Jurisdictional maximum in Local Court: 2 yrs and/or 50 pu.
Sentences
- s 9 bonds (51.0%): 38.4% were supervised; the median duration was 12 months
- full-time imprisonment (15.6%): the median full term was 9 months; the median NPP/fixed term was 5 months
- s 10 bonds (10.6%): the median duration was 12 months
- fines (8.5%): the median fine was $600; the mode was $500 (21.1%); other common fine amounts were $800 (12.1%) and $1,000 (12.1%); 50.7% of fines were in the middle 50% range of $450–$800
- suspended sentences (8.1%): 66.6% were supervised; the median duration was 9 months
- CSOs (3.6%): the median term was 100 hours
- ICOs (0.9%), s 10 dismissals (0.9%), s 10A convictions/ROC106 (0.8%)
The distribution of penalties for this offence remained largely stable since 2010. The rate of full-time imprisonment increased 2.0 pp from 2010, offset by a small decrease (1.7 pp) in the rate of s 9 bonds. As in 2010, the rate of s 9 bonds was the highest of the offences in the list. This offence had the second lowest rate of fines. The median full term and NPP/fixed term of full-time imprisonment each increased by 1 month from 2010. The median fine increased by $100. The severity of all other penalties was largely unchanged.
Domestic violence
Almost three-quarters of instances of this offence (72.7%) were recorded as having been committed in a domestic violence context.107 There was no statistically significant difference in the distribution of penalties.
10. Larceny
Crimes Act 1900, s 117.107
Maximum penalty: 5 yrs.
Jurisdictional maximum in Local Court increased in 2012:108 2 yrs and/or 20 pu (property value does not exceed $2,000); 2 yrs and/or 50 pu (property value does not exceed $5,000); 2 yrs or 100 pu (property value exceeds $5,000).
Sentences
- fines (36.1%): the median fine was $500; the mode was $500 (17.5%); other common fine amounts were $400 (12.0%) and $300 (10.3%); 55.0% of fines were in the middle 50% range of $300–$600
- s 9 bonds (24.7%): 44.2% were supervised; the median duration was 12 months
- full-time imprisonment (16.9%): the median full term was 6 months; the median NPP/fixed term was 4 months
- s 10 bonds (8.1%): the median duration was 12 months
- suspended sentences (5.7%): 63.6% were supervised; the median duration was 8 months
- CSOs (3.0%): the median term was 100 hours
- s 10A convictions/ROC110 (2.5%)
- s 10 dismissals (2.2%)
- ICOs (0.6%), HD (0.1%)
There was a slight shift towards more severe penalties for this offence from 2010, with minor increases in the use of s 9 bonds (1.5 pp) and full-time imprisonment (1.9 pp), and corresponding decreases in s 10 bonds (1.4 pp) and s 10 dismissals (1.8 pp). The median fine increased by $100, but the severity of all other penalties remained the same. Together with "knowingly contravene AVO", this offence had the third highest rate of full-time imprisonment of offences in the list.
Comparisons with sentences for this offence reported in 2010 should be approached cautiously given the increase to the jurisdictional maximum.
Property value
The vast majority (94.2%) of offences involved property valued up to $2,000 (the lower band),111 and the sentencing patterns were very similar to the overall patterns for this offence. Offences in the middle band (property from $2,001 to $5,000) and the upper band (property greater than $5,000) represented 4.3% and 2.0% of cases respectively.112
The rate of fines decreased consistently between the lower, middle and upper bands (35.4%, 13.5% and 2.1% respectively). There was a high rate of CSOs (21.3%) for offences in the upper band (compared with 2.7% in the lower band), and the median term of CSOs was higher than for the lower band (165 hours compared with 100 hours).113
Although the rate of full-time imprisonment was highest in the middle band (36.5%, compared with 17.2% in the lower band and 25.5% in the upper band), the median full terms increased consistently between the lower, middle and upper bands (6 months, 9 months and 12 months respectively). The median NPP/fixed term was 3 months in the lower band and 6 months in both the middle and upper bands.
11. Drive while suspended
Road Transport Act 2013, s 54(3)(a).
Maximum penalty: 18 mths and/or 30 pu (first offence) [automatic licence disqualification 12 mths]; 2 yrs and/or 50 pu (subsequent offence) [automatic disqualification 2 yrs].
Sentences
- fines (58.1%): the median fine amount was $600; the mode was $500 (18.4%); other common fine amounts were $600 (12.3%), $1,000 (12.1%) and $400 (10.3%); 64.3% of fines were in the middle 50% range of $400–$800
- s 10 bonds (25.9%): the median duration was 12 months
- s 9 bonds (8.0%): 14.1% were supervised; the median duration was 12 months
- s 10 dismissals (3.4%)
- s 10A convictions (1.6%)
- CSOs (1.4%): the median term was 100 hours
- suspended sentences (0.8%), full-time imprisonment (0.7%), ICOs (0.2%), HD (0.1%)
There were some changes in the distribution of penalties for this offence. The rate of s 9 bonds and s 10 dismissals both decreased from 2010 (by 2.1 pp and 3.4 pp respectively). The rate of s 10 bonds increased 6.1 pp. The median duration of both s 9 and s 10 bonds was unchanged from 2010. The median fine increased by $100.
First and subsequent offences
The vast majority (90.5%) were first offences. As Table 3 shows, subsequent offenders were more likely than first offenders to receive a s 9 bond (18.4% compared with 6.8%), a CSO (5.7% compared with 0.9%) or imprisonment (7.6% compared with 1.1%). Alternatively, subsequent offenders were less likely to receive a s 10 bond (12.4% compared with 27.3%) or s 10 dismissal (0.6% compared with 3.7%). There was no difference in the median duration of s 9 bonds between the two groups but the median fine imposed for subsequent offences was $100 higher.
Licence disqualification
Over two-thirds of offenders (70.7%) received licence disqualifications (down 2.7 pp from 2010). The median disqualification period was 12 months. The median disqualification period for subsequent offences (24 months) was double that for first offences (12 months).
12. Destroy or damage property
Crimes Act 1900, s 195(1)(a).
Maximum penalty: 5 yrs.
Jurisdictional maximum in Local Court increased in 2012: 2 yrs and/or 20 pu (property value does not exceed $2,000); 2 yrs and/or 50 pu (property value does not exceed $5,000); 2 yrs or 100 pu (property value exceeds $5,000).114
Sentences
- fines (36.4%): the median fine amount was $500; the mode was $500 (22.1%); other common fine amounts were $400 (11.6%) and $300 (10.3%); 63.5% of fines were in the middle 50% range of $300–$750
- s 9 bonds (27.6%): 38.7% were supervised; the median duration was 12 months
- s 10 bonds (19.2%): the median duration was 12 months
- full-time imprisonment (5.6%): the median full term was 4 months; the median NPP/fixed term was 3 months
- s 10 dismissals (3.7%)
- s 10A convictions/ROC115 (2.9%)
- suspended sentences (2.2%): 64.3% were supervised; the median duration was 8 months
- CSOs (2.0%): the median term was 100 hours
- ICOs (0.4%)
Sentencing patterns for this offence were more severe than those observed in 2010. The rate of fines fell 3.5 pp, while s 9 bonds increased 3.2 pp. Section 10 bonds also increased by 2.6 pp, while s 10 dismissals decreased by 3.6 pp. The median fine increased by $100. The median full term of full-time imprisonment and duration of suspended sentences each increased by 1 month from 2010.
Comparisons with sentences for this offence reported in 2010 should be approached cautiously given the increase to the jurisdictional maximum.
Property value
The vast majority (92.8%) of offences involved property valued up to $2,000116 and the sentencing patterns were very similar to the overall patterns for this offence. Offences in the middle band (property from $2,001 to $5,000) and the upper band (property worth more than $5,000) represented 5.4% and 1.8% of cases respectively.117
Although the number of offences in the upper band was small, a pattern of more severe penalties was observed. The rate of full-time imprisonment was higher (13.8% compared with 5.8% and 5.6% in the middle and lower bands respectively). Section 9 bonds were also higher (41.4% compared with 26.7% and 26.4% respectively), while the rate of fines was lower (27.6% compared with 36.0% and 37.7% respectively) as was the use of s 10 orders (13.8% compared with 18.6% and 22.3% respectively). The median duration of s 9 bonds in the upper band was 18 months, compared with 12 months in the middle and lower bands.
Domestic violence
Over one-third of instances of this offence (38.0%) were recorded as committed in a domestic violence context. There was no statistically significant difference in the distribution of penalties.
13. High-range PCA
Road Transport Act 2013, s 110(5).
Maximum penalty: 18 mths and/or 30 pu (first offence); 2 yrs and/or 50 pu (subsequent offence).
Licence disqualification: automatic 3 yrs, minimum
12 mths118(no previous major offence); automatic
5 yrs, minimum 2 yrs (previous major offence).119
Mandatory interlock:120 minimum licence disqualification period 6 mths, maximum 9 mths; minimum interlock period 24 mths (first offence); minimum licence disqualification period 9 mths, maximum 12 mths; minimum interlock period 48 mths (subsequent offence).
Sentences
- s 9 bonds (32.1%): 22.4% were supervised; the median duration was 18 months
- fines (31.8%): the median fine was $1,000; the mode was $1,000 (18.1%); other common fine amounts were $1,500 (12.6%) and $1,200 (10.4%); 51.6% of fines were in the middle 50% range of $800–$1,200
- CSOs (11.8%): the median term was 150 hours
- suspended sentences (11.3%): 54.2% supervised; the median duration was 12 months
- full-time imprisonment (5.8%): the median full term was 12 months; the median NPP/fixed term was 6 months
- ICOs (4.4%): the median duration was 11 months
- s 10 bonds (1.3%): the median duration was 24 months
- HD (1.0%), s 10A convictions (0.6%), s 10 dismissals (0.04%)
The distribution of penalties for this offence was more severe than in 2010, with a notable decrease (11.6 pp) in the rate of fines and corresponding increases in the rates of more severe penalties including s 9 bonds (4.2 pp), CSOs (1.1 pp) and imprisonment (6.2 pp). Rates of CSOs and ICOs were the highest of the offences in the list, while the rates of s 10 dismissals and s 10 bonds were the lowest.
Of the offences in the list, this offence had the highest median duration of s 9 bonds, and (together with "assault occasioning actual bodily harm") the highest median duration of suspended sentences and full terms of full-time imprisonment. The median duration of suspended sentences increased from 2010 (where it was 9 months), as did the median full term of full-time imprisonment (9.5 months in 2010). The median NPP/fixed term and the median s 9 bond remained the same as in 2010. Although this was the only offence for which the median fine did not increase from 2010, the fine amount was still the highest of any offence in the list.
First and subsequent offences
The majority (83.0%) were first offences. As Table 3 shows, subsequent offenders were far more likely to receive a sentence of imprisonment (54.4%) than first offenders (15.9%). In particular, the rate of full-time imprisonment increased from 3.3% to 18.0% if the offence was a subsequent offence, although the median full term for both categories was 12 months.
The median duration of s 9 bonds was higher for subsequent offenders (24 months compared with 15 months for first offences). The median fine was also higher ($1,200 compared with $1,000) for subsequent offences, although the rate of fines was much lower than for a first offence (6.5% compared with 36.9%).
Licence disqualification and mandatory interlock program
Almost all offenders (98.7%) were disqualified from holding a driver's licence. The median disqualification period fell to 12 months, from 24 months in 2010. When broken down between first and subsequent offenders, the median disqualification period differed (18 months and 24 months respectively).121 The decrease in the overall median disqualification period is likely due to the introduction of the mandatory interlock program, which applies to all high-range PCA offenders. For offences committed on or after 1 February 2015, 45.9% of first offenders and 46.1% of subsequent offenders were disqualified from driving for a period between the relevant minimum and maximum interlock disqualification periods, suggesting these offenders may have been subject to mandatory interlock orders.
14. Never licensed person drive on road
Road Transport Act 2013, s 53(3).
Maximum penalty: 20 pu (first offence); 18 mths and/or 30 pu (subsequent offence) [automatic licence disqualification 3 yrs].
Sentences
- fines (70.3%): the median fine was $500; the mode was $500 (18.6%); the next most common fine amount was $300 (10.7%); 60.2% of fines were in the middle 50% range of $300–$700
- s 10 dismissals (12.4%)
- s 10 bonds (9.7%): the median duration was 12 months
- s 9 bonds (3.5%): 10.0% were supervised; the median duration was 12 months
- s 10A convictions (3.1%)
- full-time imprisonment (0.4%), CSOs (0.4%), suspended sentences (0.2%), ICOs (0.04%)
Sentencing patterns for this offence were slightly more lenient than in 2010. The proportion of offenders receiving s 10 dismissals and s 10 bonds increased by 1.7 pp and 1.3 pp respectively. There were decreases of 1.7 pp and 1.0 pp in the rate of s 9 bonds and fines respectively. This offence had the second highest rate of fines of offences in the list and the second highest rate of s 10 dismissals (together with "drive while suspended under s 66 of the Fines Act 1996"). The median fine increased by $100 from 2010.
First and subsequent offences
While the majority (68.5%) were first offences, this offence had the second highest proportion of subsequent offences after "drive while disqualified". As Table 3 shows, although there was no notable difference in the rate of fines, the median fine amount differed between first and subsequent offences ($450 and $600 respectively). The rate of s 9 bonds was higher for subsequent offences (10.2% compared with 0.5% for first offences), whereas the rate of s 10 dismissals was higher for first offences (16.2% compared with 4.0% for subsequent offences). While a term of imprisonment is not available for a first offence, imprisonment was imposed on 3.2% of subsequent offenders.
Licence disqualification
Nearly one-third of offenders (32.3%) were disqualified from holding a licence. This low rate may be attributed to the fact an automatic licence disqualification only applies to subsequent offences. The rate of disqualification for subsequent offences was 85.8% compared with 7.6% for first offences. Overall, the median licence disqualification period was 3 years (equal to the automatic disqualification period for a subsequent offence). Where a licence disqualification was ordered in respect of a first offence, the median was 6 months.
15. Goods in custody
Crimes Act 1900, s 527C(1).122
Maximum penalty: 6 mths and/or 5 pu; 12 mths and/or 10 pu (where motor vehicle, vessel, or part thereof).
Sentences
- fines (38.9%): the median fine was $500; the mode was $500 (24.5%); the next most common fine amount was $400 (12.2%); 63.2% of fines were in the middle 50% range of $300–$600
- s 9 bonds (30.3%): 40.3% were supervised; the median duration was 12 months
- full-time imprisonment (16.3%): the median full term and median NPP/fixed term was 3 months
- s 10 bonds (5.0%): the median duration was 12 months
- suspended sentences (3.5%): 47.8% were supervised; the median duration was 4 months
- s 10A convictions/ROC123 (3.0%)
- CSOs (1.6%): the median term was 90 hours
- s 10 dismissals (1.0%), ICOs (0.3%), HD (0.1%)
The distribution of penalties for this offence was largely similar to those observed in 2010. The slight decrease in the use of s 10 dismissals (1.2 pp), s 10 bonds (1.9 pp) and CSOs (1.2 pp) was offset by increases in the rates of s 10A convictions and fines (by 1.2 pp and 4.8 pp respectively). The median fine increased by $100, while the median term of CSOs decreased by 10 hours. The median duration of s 9 and s 10 bonds, suspended sentences and full-time imprisonment remained the same. The proportion of supervised suspended sentences increased 12.5 pp.
16. Drive while suspended under s 66 of the Fines Act 1996
Road Transport Act 2013, s 54(5)(a)(i).
Maximum penalty: 18 mths and/or 30 pu (first offence) [automatic licence disqualification 3 mths]; 2 yrs and/or 50 pu (subsequent offence) [automatic disqualification 2 yrs].
Sentences
- fines (59.7%): the median fine was $500; the mode was $500 (21.3%); other common fine amounts were $300 (14.3%) and $400 (13.6%); 67.0% of fines were in the middle 50% range of $300–$600
- s 10 bonds (23.9%): the median duration was 12 months
- s 10 dismissals (12.4%)
- s 9 bonds (1.8%): 21.9% were supervised; the median duration was 12 months
- s 10A convictions (1.5%)
- full-time imprisonment (0.4%), CSOs (0.3%), ICOs (0.1%)
Sentences for this offence were more severe than those observed in 2010. The rate of s 10 dismissals decreased by 9.8 pp, offset by increases in fines and s 10 bonds (8.7 pp and 2.0 pp respectively). The median fine increased by $100. The offence (together with "never licenced person drive on road") had the second highest rate of s 10 dismissals of offences in the list. The rate of s 9 bonds decreased by 1.0 pp, but the proportion of supervised s 9 bonds increased 12.4 pp. The rate of full-time imprisonment for this offence, together with "never licensed person drive on road", was the lowest in the list where a term of imprisonment is available.124 However, in 2010 no offenders received full-time imprisonment.
First and subsequent offences
First offences accounted for 93.2% of instances of this offence. As Table 3 shows, the median fine for subsequent offences was higher ($600 compared with $500 for a first offence). The rates of s 10 dismissals and s 10 bonds were lower for subsequent offences (5.7% and 18.7% respectively) than for first offences (12.9% and 24.3% respectively).
Licence disqualification
Over half of offenders (63.6%) were disqualified from holding a driver's licence (up 7.7 pp from 2010). The median disqualification period for a first offence was 3 months, as was the mode (85.8%). Where the offence was a subsequent offence, the median disqualification period increased to 24 months reflecting the automatic disqualification period.
17. Drive without being licensed
Road Transport Act 2013, s 53(1)(a).
Maximum penalty: 20 pu.
Sentences
- fines (75.8%): the median fine was $500; the mode was $500 (18.3%); other common fine amounts were $400 (10.9%) and $300 (10.6%); 57.9% of fines were in the middle 50% range of $300–$600
- s 10 dismissals (13.3%)
- s 10 bonds (6.8%): the median duration was 9.5 months
- s 10A convictions (3.6%)
- s 9 bonds (0.4%)
This offence had the highest rate of both fines and s 10 dismissals of any offence in the list. The distribution of penalties was very similar to that reported in 2010, although the rate of s 10 dismissals decreased slightly (2.0 pp), whereas the rate of fines increased slightly (1.3 pp). The median fine increased by $100 from 2010, while the median duration of s 10 bonds decreased (12 months in 2010). The rate of s 10A convictions was the second highest of the offences in the list.
First and subsequent offences
The majority (79.5%) of offences were first offences. Unlike other traffic offences in the list, the legislation does not prescribe a different penalty for subsequent offences. However, as Table 3 shows, not only was the rate of fines higher for subsequent offences (88.9% compared with 72.5% for first offences), so was the median fine ($500 compared with $400). The rate of s 10 dismissals was much lower for subsequent offences (3.4% compared with 15.8% for first offences).
Licence disqualification
This offence is the only traffic offence in the list without an automatic licence disqualification regardless of whether the offence is a first or subsequent offence.125 Only 14.7% of offenders were disqualified from driving. As in 2010, the median disqualification period was 12 months and the mode was 3 years (29.6%). The median for subsequent offences (12 months) was double that for first offences (6 months).
18. Assault with intent on certain officers
Crimes Act 1900, s 58.
Maximum penalty: 5 yrs.
Jurisdictional maximum in Local Court: 2 yrs and/or 50 pu.
Sentences
- s 9 bonds (40.1%): 37.2% were supervised; the median duration was 12 months
- fines (21.4%): the median fine was $500; the mode was $500 (25.4%); the next most common fine amount was $1,000 (13.4%); 55.8% of fines were in the middle 50% range of $400–$800
- full-time imprisonment (13.8%): the median full term was 7 months; the median NPP/fixed term was 4 months
- s 10 bonds (10.8%): the median duration was 12 months
- suspended sentences (5.4%): 68.2% were supervised; the median duration was 8 months
- CSOs (5.3%): the median term was 100 hours
- s 10 dismissals (1.3%)
- s 10A convictions/ROC126 (1.0%), ICOs (0.8%), HD (0.1%)
The distribution of penalties for this offence was more severe than in 2010. There were decreases in the rate of fines (8.5 pp), s 10 dismissals (1.5 pp) and suspended sentences (1.2 pp), and increases in the rates of full-time imprisonment (5.0 pp), s 9 bonds (3.9 pp) and CSOs (2.1 pp).
The median fine increased ($450 in 2010), as did the median full term of full-time imprisonment (6 months in 2010). The median term of suspended sentences decreased (9 months in 2010).
Assault officer and resist or wilfully obstruct officer
Of those sentenced for this offence, 54.7% assaulted an officer in the execution of his or her duty and 45.3% resisted or wilfully obstructed an officer in the execution of his or her duty.
Figure 2 shows the distribution of penalties and demonstrates that sentencing patterns differed between the two groups of offenders. Those who assaulted an officer received harsher penalties, including higher rates of full-time imprisonment (16.9%), suspended sentences (7.3%), CSOs (6.9%) and s 9 bonds (42.8%), compared to those sentenced for resisting or obstructing an officer (10.0%, 3.1%, 3.4% and 36.8% respectively).
Figure 2: Distribution of penalty types for assault and resist/obstruct officer in execution of duty offences in the Local Court in 2015
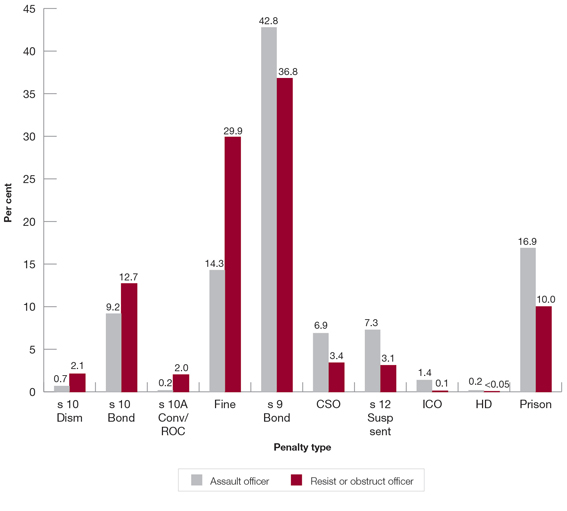
However, these differences were not as marked as in 2010 because penalties for resisting or obstructing an officer have increased in severity: the rate of fines decreased 14.0 pp, while rates of full-time imprisonment and s 9 bonds increased by 5.8 pp and 7.1 pp respectively.
Sentencing outcomes within penalty types also differed, with assaulting an officer attracting more severe penalties. The median fine was $600, compared with $500 for resisting or obstructing an officer (both amounts increased by $100 from 2010). The median term of full-time imprisonment for assaulting an officer was 8 months and the median NPP/fixed term was 4 months whereas for resisting or obstructing an officer the median full term and NPP/fixed term were both 3 months.
19. Fraud
Crimes Act 1900, s 192E(1).
Maximum penalty: 10 yrs.
Jurisdictional maximum in Local Court: 2 yrs or 100 pu.
Sentences
- s 9 bonds (32.3%): 38.4% were supervised; the median duration was 12 months
- full-time imprisonment (21.0%): the median full term was 10 months; the median NPP/fixed term was 6 months
- fines (19.3%): the median fine was $500; the mode was $500 (25.6%); the next most common fine was $1,000 (12.2%); 55.9% of fines were in the middle 50% range of $368.75–$800
- suspended sentences (8.6%): 51.7% were supervised; the median duration was 10 months
- CSOs (7.2%): the median term was 150 hours
- s 10 bonds (6.1%): the median duration was 12 months
- ICOs (2.6%): the median duration was 10 months
- s 10A convictions (1.4%)
- HD (0.8%), s 10 dismissals (0.8%)
As indicated earlier in the Trends, this is the first time this offence has appeared in the top 20 list. This offence had the greatest proportion of custodial sentences (24.4%) of the offences in the list. It had the highest rate of full-time imprisonment (together with "assault occasioning actual bodily harm"), the second highest rate of HD and the fourth highest rate of ICOs. The use of more severe penalties is unsurprising given the maximum penalty for this offence is the highest of any offence in the list. Together with "high-range PCA" and "assault occasioning actual bodily harm", this offence had the highest median CSO hours.
20. Special-range PCA
Road Transport Act 2013, s 110(2).
Maximum penalty: 10 pu (first offence); 20 pu (subsequent offence).
Licence disqualification: automatic 6 mths, minimum 3 mths127 (no previous major offence); automatic 12 mths, minimum 6 mths (previous major offence).128
Mandatory interlock:129 minimum licence disqualification period 1 mth, maximum 3 mths; minimum interlock period 12 mths.
Sentences
- fines (62.5%): the median fine was $400; the mode was $400 (18.3%); other common fine amounts were $500 (18.2%) and $300 (18.0%); 62.8% of fines were in the middle 50% range of $300–$500
- s 10 bonds (32.7%): the median duration was 12 months
- s 10 dismissals (2.6%)
- s 10A convictions (1.7%)
- s 9 bonds (0.4%), CSOs (0.1%)
Overall, sentencing patterns for this offence were more lenient than those reported in 2010. There was a decrease in the rate of fines (7.3 pp) and an increase in s 10 bonds (8.1 pp). The offence had the second highest rate of s 10 bonds of the offences in the list (after "low-range PCA"). The median fine increased by $100 from 2010. The median duration of s 10 bonds remained the same.
First and subsequent offences
The majority (90.5%) of offences were first offences. As Table 3 shows, subsequent offenders were more likely to receive a fine (88.4% compared with 59.8% for first offences) than a s 10 bond (8.4% compared with 35.3%). The median fine for subsequent offences was higher ($500 compared with $400).
Licence disqualification and mandatory interlock program
Nearly two-thirds of offenders (64.7%) were disqualified from holding a driver's licence. The median licence disqualification period was 3 months, as was the mode (57.8%) (both unchanged from 2010). The median disqualification period increased to 6 months for subsequent offences. Of the offenders sentenced for a subsequent offence committed on or after 1 February 2015, 60.3% received licence disqualification periods of between 1 and 3 months suggesting they may have been subject to a mandatory interlock order.
Regulatory offences
A broad range of conduct can amount to a criminal offence and it is not necessary that a court deals with every offence. A large number of matters can be dealt with by way of a penalty infringement notice. A number of regulatory offences (and particular statutory offences) may be dealt with in this way.130 Traffic offences are a notable example. To demonstrate the magnitude of offending and to place the number of matters dealt with in the court in some context, figures available from the Office of State Revenue indicate that, in 2015, police issued 211,836 penalty infringement notices for exceed speed limit offences.131 In the same period the court dealt with 5,643 offences, of which 4,365 were the principal offence.
Table 4 shows the 10 most common regulatory offences (principal offences only) dealt with by the court in 2015.
Table 4: Most common regulatory offences (principal offence only) sentenced in the NSW Local Court in 2015
|
Rank |
Offence |
Legislation |
Number of cases |
% of cases |
|
1 |
Exceed speed limit |
Road Rules 2014, r 20a |
4,365 |
29.1 |
|
2 |
Proceed through a red traffic light |
Road Rules 2014, r 59(1)a |
869 |
5.8 |
|
3 |
Disobey no stopping/no standing signs |
Road Rules 2014, r 167a |
769 |
5.1 |
|
4 |
Proceed through a red traffic arrow |
Road Rules 2014, r 60a |
715 |
4.8 |
|
5 |
Drive using a mobile phone |
Road Rules 2014, r 300(1)a |
611 |
4.1 |
|
6 |
Fail to comply with licence conditions |
Road Transport (Driver Licensing) Regulation 2008, r 114(1) |
509 |
3.4 |
|
7 |
Driver fail to wear seatbelt properly adjusted/fastened |
Road Rules 2014, r 264(1)a |
290 |
1.9 |
|
8 |
Disobey no left turn and no right turn signs |
Road Rules 2014, r 91a |
284 |
1.9 |
|
9 |
Travel or attempt to travel without valid ticket |
Passenger Transport Regulation 2007, r 77A(1) |
198 |
1.3 |
|
10 |
Learner not accompanied by driver/police officer/tester |
Road Transport (Driver Licensing) Regulation 2008, r 15(1)(a) |
197 |
1.3 |
|
All remaining regulatory offences |
6,183 |
41.2 |
||
|
Total for top 10 regulatory offences |
8,807 |
58.8 |
||
|
Total number of cases |
14,990 |
100.0 |
a These offences include a small number of cases dealt with under the same rules of the Road Rules 2008 (rep).
There were a number of amendments to the rules and regulations following the 2010 study, including the introduction of the Road Rules 2014 to replace the Road Rules 2008.132 However, these did not substantially change the offences or penalties considered in the Trends.
There was a decrease in the number of regulatory principal offences dealt with by the court. In 2015, regulatory offences accounted for 12.5% of all principal offences (19.0% (24,253 offences) in 2010). The 10 most common regulatory principal offences in 2015 represented 58.8% of all principal regulatory offences (52.0% in 2010).
The most common penalty for regulatory offences was a fine (57.0%), although this rate was 12.6 pp less than that reported in 2010. The median fine was $300 ($100 higher than 2010), the mode was $200 (9.8%) and 54.9% of fines were in the middle 50% range of $200 to $436. The next most common penalty, s 10 dismissals (31.1%), increased 5.0 pp from 2010. Other penalty types imposed were s 10 bonds (8.6%), an increase of 7.2 pp from 2010 and s 10A convictions (3.3%), an increase of 0.5 pp from 2010.133
The distribution of the 10 most common regulatory offences (principal offences only) differed from that observed in 2010. As in 2010, "exceed speed limit" was the most common offence, representing 29.1% of cases (a 6.3 pp increase in the proportion of cases from 2010).134 There was a marked difference between the number of cases for that offence and all other regulatory offences. Four new offences appeared in the list.135 The offence "proceed through a red traffic light" moved from the ninth most common in 2010 to second most common in 2015 (with a 4.0 pp increase in the proportion of cases represented). There were only minor changes in the rankings for the remaining offences on the list. "Exceed speed limit" was the only regulatory offence to rank in the top 20 (at rank 12) when all proven offences were considered.
All proven offences
Distribution of most common offences — all proven offences
Appendix B, titled "Distribution of penalty types for the most common proven offences in the NSW Local Court in 2015", presents offence and sentencing information based on an analysis of all proven offences. The table groups offenders and offences in five discrete categories based on whether the offence was the principal offence or a secondary offence and whether one or multiples of the particular offence were involved.
Presenting sentencing information in this way demonstrates that other sentencing considerations have an impact on an individual sentence when a court is required to sentence an offender for more than one offence. However, it should be noted that the following analysis is offence based and the same offender may appear in several of the offences in Appendix B. It is also important to understand that the relationship between the number of offences and the number of offenders has the potential to bias results where few offenders are responsible for many offences.
When the analysis focuses on the penalties imposed for all offences there are some noteworthy changes, not only to the offences that appear in the most common offences list, but also to the distribution of penalties for those offences.
Four new offences appeared in the top 20 list that were not in the top 20 statutory principal offences.136 The most common regulatory offence "exceed speed limit" became the 12th ranked offence overall. The statutory offence of "use unregistered registrable vehicle on road"137 was 16th and "fail to appear in accordance with bail acknowledgment"138 was 18th. The increased incidence of the latter two offences can be attributed to the fact that in 79.3% and 88.0% of cases respectively these offences were not the principal offence. "Fail to comply with requirements under taxation laws"139also moved into the top 20 at rank 20. The majority of these offenders (86.2%) were sentenced for multiple counts of this offence, averaging 7.8 offences each. This accounts for why it does not feature in the top 20 principal offences.
Comparing the penalty distribution for the offences in Appendix B with that shown in Table 2 reveals that when all offences are considered, a general trend can be observed of increased rates of more severe penalties such as sentences of imprisonment. Alternatively, decreases in less severe penalties such as fines and s 10 orders can be observed. Interestingly s 10A convictions were more commonly used in connection with some offences than is reflected by sentencing analysis which focuses solely on the principal offence.
General trends can also be observed when comparing the penalty distribution for specific groups of offenders. Offenders with only one offence before the court recorded higher rates of s 10 orders than any other offender group. They also recorded the lowest rates of full-time imprisonment. On the other hand, offenders who were sentenced for multiple counts of a particular offence but also had a more serious offence dealt with by the court recorded higher rates of full-time imprisonment than other offender groups.
A clearer picture of the use of s 10A convictions can be seen. This penalty was used more often where there were multiple offences but the offence was not the principal offence, particularly for offences that attract a high rate of fines, such as "possess prohibited drug", "drive with presence of prescribed illicit drug", "exceed speed limit", "use unregistered registrable vehicle on road", "never licenced person drive on road", "drive while suspended under s 66 of the Fines Act 1996" and "drive without being licenced". This penalty option appears to be operating as intended.140
"Fail to appear in accordance with bail acknowledgment" was the only offence in the list where s 10A convictions were used more commonly than any other penalty, regardless of offender group. This is unsurprising given that these offenders are likely to have a more serious matter before the court at the time of sentencing.
As expected, for particular offences where the ratio between the number of offences and the number of offenders was close to 1:1, little difference was observed in the distribution of penalties between principal offences and all offences. This included "assault occasioning actual bodily harm" and every traffic offence in the list, except "drive while disqualified".
The most marked differences in the rate of particular penalties with respect to some of the offences are discussed below. The ranking of the offence both in Appendix B (all proven offences) and Table 1 (top 20 statutory principal offences) is identified.
Possess prohibited drug
Appendix B rank: 1; Table 1 rank: 1
This offence remained the most common offence in both analyses. Almost half (47.9%) of all offences were single instance offences. The rate of s 10 orders was much higher for the group of offenders with only one offence before the court, while the rate of s 9 bonds was much lower when compared to offenders with multiple offences. However, sentences of full-time imprisonment were imposed in 5.3% of all offences compared with 2.1% when it was the principal offence (see Table 2). The rate of s 10A convictions was also higher for all offences (7.6% compared with 3.2%).
Common assault
Appendix B rank: 2; Table 1 rank: 3
This offence was ranked second overall when all proven offences were taken into account. The overall distribution of penalties displayed in Appendix B differed to those displayed in Table 2. Consistently with the overall trend for all offences, a higher rate of full-time imprisonment (15.6% compared with 6.3%) and a lower rate of s 10 bonds (16.2% compared with 23.7%) could generally be observed compared with analysis of the principal offence. The rate of ICOs was also higher (1.6% compared with 0.7%).
Knowingly contravene AVO
Appendix B rank: 3; Table 1 rank: 7
This offence was the third most common offence when ranked by number of all proven offences. There was an increased incidence of full-time imprisonment when all offences were considered (27.3% compared with 16.9% for principal offences only (see Table 2)), and the rate of fines was much lower (10.9% compared with 16.2%).
Destroy or damage property
Appendix B rank: 4; Table 1 rank: 12
When all proven offences were considered, this offence became the fourth most common offence. As Appendix B shows, 58.7% of all instances of this offence were committed in circumstances involving multiple offences where this offence was not the principal offence, indicating the offence is often committed as part of a broader and more serious course of criminal conduct. This is also reflected in the overall penalty distribution, where the rate of full-time imprisonment (15.8%) was almost triple that reported in Table 2 on the basis of principal offences only (5.6%).
Larceny
Appendix B rank: 5; Table 1 rank: 10
This offence became the fifth most common when all proven offences were taken into account. As Appendix B shows, this offence is often committed by offenders multiple times (1,205 offenders were responsible for 3,859 counts of this offence).141 The distribution of penalties overall differed to those displayed in Table 2 based only on the principal offence, with the rate of full-time imprisonment being nearly double (31.1% compared with 16.9%). ICOs were ordered in 1.3% of offences compared with 0.6% where the offence was the principal offence.
Fraud
Appendix B rank: 9; Table 1 rank: 19
A vastly different picture of this offence is portrayed when all proven offences are examined, particularly in regard to the prevalence of the offence which rose 10 places to rank ninth overall. The number of offences displayed in Appendix B demonstrates that in most cases, fraud is committed multiple times by offenders, with 881 offenders responsible for 5,515 counts of this offence.142 Consistent with the overall trend observed earlier, there were notable differences between Appendix B and Table 2 for the total rates of fines (7.8% compared with 19.3% for principal offences only) and full-time imprisonment (41.1% compared with 21.0%). The rate of full-time imprisonment was the highest of all offences in Appendix B.
Conclusion
Overall, the distribution of the 20 most common statutory principal offences in the court in 2015 was similar to that observed in 2010 in that:
- Eighteen offences appearing in the 2015 list were also in 2010 list.
- Four of the five most common offences in 2010 remained in the top five.
- Traffic offences remained prominent, representing half the statutory offences in the list (11 of the top 20 in 2010).
Two new offences appeared in the list in 2015: "drive with presence of prescribed illicit drug" and "fraud". Significantly, "drive with presence of prescribed illicit drug" entered the list at fifth ranking. Other changes in rankings for the most common statutory principal offences included:
- Seven of the 10 traffic offences in the list fell in ranking while "special-range PCA" maintained the same ranking, "drive with presence of prescribed illicit drug" was new in the list, and "drive while suspended under s 66 of the Fines Act 1996" moved up two rankings (18th to 16th).
- The two offences under the Crimes (Domestic and Personal Violence) Act 2007 increased in ranking: "knowingly contravene AVO" rose from eighth in 2010 to seventh in 2015, "stalk or intimidate with intent to cause fear of physical or mental harm" rose from 13th in 2010 to ninth.
- Assault related offences, that is "common assault", "assault occasioning actual bodily harm" and "assault with intent on certain officers", were all ranked lower than in 2010.
- Changes in the rankings of property related offences were mixed: "larceny" maintained the same ranking (10th), "destroy or damage property" fell from ninth in 2010 to 12th in 2015 and "goods in custody" increased from 19th to 15th.
The overall distribution of penalties for statutory principal offences in 2015 was largely similar to that observed in 2010, although the following can be noted:
- Fines remained the most common penalty (imposed on 41.3% of offenders), although down 2.4 pp from 2010. The second most common penalty (s 9 bonds) remained stable.
- Dismissals and discharges without conviction under s 10 remained the third most common penalty, increasing 0.9 pp from 2010 (19.7%). The proportion of offenders being discharged unconditionally (4.8%) was less than in 2010 (down 1.3 pp), while those conditionally discharged on a bond (14.9%) increased (up 2.4 pp).
- The rate of full-time imprisonment (8.4%) increased 1.5 pp from 2010.
- ICOs were imposed in 1.0% of cases (this penalty came into effect during the previous Trends period).
Like 2010, sentencing patterns continued to show a high rate of non-custodial sentences among the 20 most common statutory principal offences in the court. However, the following observations about sentencing patterns and severity in 2015 can be made:
- Median fine amounts increased from 2010 for all offences except "high-range PCA" (although the median fine for "high-range PCA" remained the highest median amount).
- The offences of "stalk or intimidate with intent to cause fear of physical or mental harm", "common assault", "assault occasioning actual bodily harm" and "assault with intent on certain officers" received the highest rates of s 9 bonds (51.0%, 41.5%, 40.8% and 40.1% respectively). The longest median duration of a s 9 bond was 18 months, imposed for "high-range PCA".
- For the majority of offences appearing in the list for which a term of imprisonment was available, either the median full term or median NPP/fixed term of full-time imprisonment for principal offences increased from 2010.143
- Overall, changes in sentencing patterns from 2010 were mixed. Penalties for the offences "common assault", "knowingly contravene AVO", "assault occasioning actual bodily harm", "destroy or damage property", "high-range PCA", "drive while suspended under s 66 of the Fines Act 1996" and "assault with intent on certain officers" were observed to be more severe than those reported in 2010, while penalties for "low-range PCA", "never licensed person drive on road" and "special-range PCA" were observed to be generally more lenient than 2010.
A consideration of all proven offences presents a more complete picture of the 20 most common offences dealt by the court. The following distinctions to the principal offence analysis may be noted:
- Several offences rose in ranking: "knowingly contravene AVO" (7th to 3rd), "destroy or damage property" (12th to 4th), "larceny" (10th to 5th) and "fraud" (19th to 9th).
- Three new statutory offences entered the top 20: "use unregistered registrable vehicle on road" (rank 16), "fail to appear in accordance with bail acknowledgment" (rank 18) and "fail to comply with requirements under taxation laws" (rank 20).
- The top regulatory offence "exceed speed limit" was the 12th most common offence overall when all proven offences were considered.
- Four traffic offences fell out of the top 20: "high-range PCA", "drive while suspended under s 66 of the Fines Act 1996", "drive without being licensed" and "special-range PCA".
The following sentencing patterns were observed for all proven offences:
- Where available, higher rates of custodial sentences for each offence were typically evident when the sentencing distribution for all proven offences was compared to that for principal offences only. In particular, the rate of full-time imprisonment was more than 10 pp higher for "knowingly contravene AVO", "destroy or damage property", "larceny", "goods in custody" and "fraud" when all proven offences were considered. "Fraud" had the highest rate of full-time imprisonment in both analyses (21.0% for principal offences only (Table 2) and 41.1% for all proven offences (Appendix B)).
- Offenders with only one offence received more lenient sentences compared with other groups of offenders, whereas offenders with multiple offences received harsher penalties, particularly where they were also being sentenced for at least one more serious offence.
- The use of s 10A convictions as a method of disposing of secondary offences was evident, particularly for offences that attract a high rate of fines.
- As the analysis of all proven offences demonstrated, the sentencing task is a complex exercise. Penalties imposed for individual offences are influenced by the seriousness of the offence, whether it is committed as part of a broader course of conduct and whether the totality principle applies.