Sentencing Deception Offenders
Part 1 – Local Courts
by
Patricia Gallagher
Senior Research Officer
Introduction
There is a perception in the community that offences involving deception are on the increase. Such crimes are viewed as insidious; there is no physical harm or violence to victims, but the cost to the community can be measured in millions of dollars. This paper describes the characteristics associated with deception offences dealt with in the Local Courts, and examines the sentencing of such offenders. This group includes white collar criminals, forgers, utterers, social security and insurance cheats as well as old-fashioned confidence tricksters’. Also included is the growing area of computer crime. This paper, focusing on the Local Courts, is the first of a two-part report on deception offences. Part 2 will examine deception offences dealt with in the higher courts. It is hoped that this report will provide judicial officers with a number of useful insights into the sentencing of such offenders.
Profile of offences
Deception offences encompass offences which involve a betrayal of trust. Various types of fraud constitute the bulk of these crimes, such as obtaining money by deception, misappropriation, and passing valueless cheques. Social security offences are often a special case of fraud, usually involving making false statements in order to gain a benefit. However, they also include, for example, employees divulging information which they have obtained through their position. Also of interest are the less common, but perhaps more serious offences such as forgery, bribery and computer crime. Sophisticated crimes such as embezzlement and bankruptcy offences are included. The latter includes attempts to gain from the process of bankruptcy, for example taking on a large debt, or gambling money recklessly, when bankruptcy is imminent. Immigration and passport offences usually involve persons who are residing or working in Australia illegally, as well as their accomplices. Sometimes Australian or foreign passports are forged, but often people have simply produced false documents or statements in order to procure a passport.
Using data collected by the NSW Bureau of Crime Statistics and Research, all Local Courts cases were selected for the period January 1994 to June 1995, where the principal offence was a deception offence.[1] There were a total of 4,633 cases. Factors, such as age, sex and prior convictions of offenders and penalties, were then identified and analysed. It is interesting to note that, where the charge was a deception offence, a guilty’ outcome was the result in 80% of cases. There was a high guilty plea rate (83% of the guilty’ outcomes were from pleas).
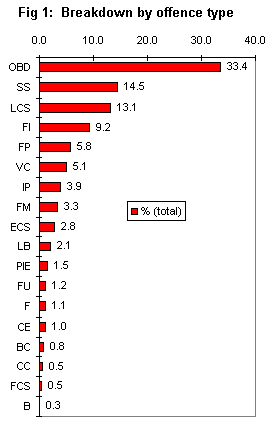
Obtaining money or goods by deception remained the most common category for offences, with 33% of principal offences falling into this group. The next largest was social security fraud, with 14% of principal offences falling into this group. This category has a particularly high conviction rate (95% of all social security offences had a guilty’outcome). The third category was larceny as a clerk or servant, with 13 % of offences. See Figure 1 for relative frequencies of all offence groups.
Key to Figs 1 and 2
| OBD | obtain money/goods by deception |
| SS | social security fraud |
| LCS | larceny clerk/servant |
| FI | false instruments |
| FP | false pretences |
| VC | valueless cheques |
| IP | immigration/passport |
| FM | fraudulent misappropriation |
| ECS | embezzlement clerk/servant |
| LB | larceny as bailee |
| PIE | prohibited import/export |
| FU | forgery/uttering |
| F | fraud |
| CE | customs and excise |
| BC | bribery/corruption |
| CC | computer crime |
| FCS | falsification by clerk/servant |
| B | bankruptcy |
Profile of offenders
Sex
Deception offences are committed by a relatively high number of female offenders, as compared to other types of offence. For all offences in the Local Courts during the period of this data, only 15% of offenders were female. For deception offences, however, 32% of offenders were women, the pattern being substantially consistent across specific categories of the offences. Figure 2 shows the gender breakdown for each offence group.
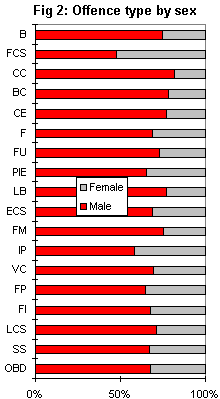
The category with the smallest proportion of women was computer crime. There were only 22 cases, of which 4 were women. The category with the largest proportion of women was falsification as a clerk or servant, probably reflecting the over-representation of women in that type of occupation, although again the numbers were small, with 21 cases.
Age
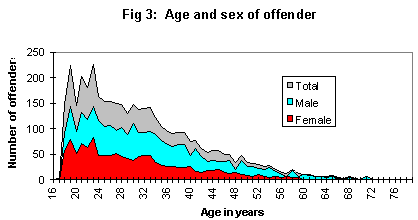
The overall mean age for deception offenders was 31.5 years, with a standard deviation of 10.7 years. Like most offender populations, the age distribution was skewed to the right, with younger age groups being over-represented. The median was 29 years, and three-quarters of the sample was under 38 years. Figure 3 shows the distribution of age by sex of offender.
The female population of offenders was slightly younger than the male. The mean age for women was 30.3 years, with a median of 28 years, and 75% of them were under 36 years. This contrasts with the male population, who had a mean age of 32.1 years, a median of 30 years, and 75% of the population under 38 years. Nevertheless, the oldest offender in this sample, at 82 years, was female.
Looking at specific offence groups, bankruptcy, customs, prohibited imports/exports and social security offences had particularly high mean ages – all over 36 years. The highest was for customs offences, with a mean of 38.4 years. The group with the lowest mean age was larceny as a clerk or servant, at 29 years. This is still fairly close to the mean, reflecting the skewed nature of the data. The small numbers of women in some categories precluded a detailed analysis of gender at this point. However, the group with the lowest mean age for women, 26.8 years, was larceny as a bailee, and the highest was prohibited imports/exports, with a mean of 36.2 years. The pattern for males generally followed the overall results.
Prior convictions
Information on prior convictions of offenders is often not available, resulting in a high proportion for the unknown’ category.[2]
Consequently figures for offenders with and without a prior conviction are very conservative. For deception offenders, 35% definitely had at least one prior conviction, 23% had no prior conviction, and the information was unavailable for 42%. Women were less likely to have a prior conviction. The gender breakdown is given in Table 1.
Table 1: Prior convictions by sex of offender
| Male | Female | Total | |
|---|---|---|---|
| Yes | 40% | 24% | 35% |
| No | 20% | 29% | 23% |
| Unknown | 40% | 47% | 42% |
The mean ages for those with a prior conviction was 32.1 years for men and 30.1 years for women. Those with no prior conviction, not surprisingly, were slightly younger. The mean for men was 30.8 years, and for women 28.9 years.
When looked at by offence group, the cell sizes were too small in many categories to draw any firm inferences. However, of those which had reasonable numbers, offence groups which had a notably high number of offenders with prior records were false instrument (49%), larceny as a bailee (54%), and valueless cheques (53%). Those which had fewer than expected offenders with a prior record were larceny as a clerk/servant (25%), falsification as a clerk/servant (29%) and social security offences (22%). Larceny as a clerk/servant is an offence prevalent among relatively young female offenders, as outlined above, so that result is not surprising. The proportion where prior record was unknown was extremely high for social security offences (71%), so that result should be treated with caution.
Multiple counts
Most offenders (76%) had only one count for the principal offence. A further 9% had two counts, and 4% had three. The remaining 11% had between 4 and 99 counts. The mean number of counts for each offender was 2.4. Offences with particularly high overall mean counts were falsification as a clerk/servant, with 6.9; embezzlement as a clerk/servant, with 3.8; obtain money by deception with 3.1; and valueless cheques with 3.0.
Female offenders had a higher mean count (2.7 compared with 2.2 for males). However, the standard deviation was also larger for women, which suggests some extreme values. For larceny as a clerk/servant – predominantly a female offence and one with a large number of offenders – the female mean number of counts was 3.6, compared with a male mean of 1.8. Falsification as a clerk/servant also had a high female mean – 8.3 compared with a male mean of 5.4, although it had only 21 cases.
The mean count also differed between age groups, with 41-50 years having the highest mean count, 3.4. (In this age group, the female mean was 5.3, while the male mean was 2.7.) Those under 21 and over 60 had the lowest means, 2.0 and 1.9 respectively.
Value of Property
Some deception offences are dealt with differently depending on the amount of money involved. These include offences involving larceny, fraud or misappropriation, obtaining money by deception, embezzlement, valueless cheques, and bribery. There are four standard amounts: $2,000 or less; $2,001-5,000; $5,001-15,000; and over $15,000 (the latter is dealt with in the higher courts).
There are also bankruptcy offences which involve obtaining credit while bankrupt, for amounts over $3,000. However, there were only 3 cases of bankruptcy offences involving more than $3,000, so these were not included. Offences which do not specify the amount of money involved include forgery, false instrument, and most Commonwealth offences. The distribution of offences by property amount is given in Figure 4.
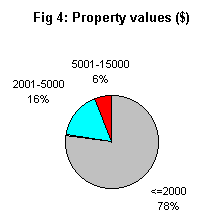
There were no gender differences in terms of value of property, and the only age differences were that a larger proportion (81%) of the youngest age group (less than 21 years) and a relatively small proportion (67%) of the 51-60 years age group, involved amounts of $2,000 or less. For the latter, 26% of offences involved amounts of $2,001-5,000, which is relatively high.
When examined by offence, there are one or two patterns of interest, although they should be treated with caution because of the small numbers involved. Fraudulent misappropriation had high proportions in the higher value categories, 24% involved between $5,001 and 15,000, 19% between $2,001 and 5,000, and only 44% in the $2,000 or less category. Obtain money /goods by deception generally involved low amounts, 82% being for $2,000 or less, and nothing over $5,000.
Sentencing outcomes
Table 2 summarises the penalty outcomes, in order of frequency, for males, females and overall. The bulk of offences were dealt with by recognizances and fines, then to a lesser extent with community service orders (CSOs). Custodial sentences were relatively infrequent.
Other penalties such as Rising of the Court (ROC), Community Aid Panel (CAP) and Intensive Community Service (ICS), had a total of 28 cases – around 0.5%. There were four cases where the offender was a company or corporation, and the penalty was a fine. Overall, women were more likely to receive a recognizance, and less likely to be fined or to receive a custodial sentence.
Table 2: Outcomes in order of frequency
| Male | Female | Total | |
|---|---|---|---|
| Recognizance | 36% | 45% | 39% |
| Fine | 33% | 29% | 32% |
| CSO | 16% | 17% | 16% |
| Imprisonment | 9% | 5% | 8% |
| Dismissed | 3% | 3% | 3% |
| Periodic Detention | 3% | 1% | 2% |
Looking at age, offenders under 21 years were more likely to receive a dismissal (6%), or to be fined (40%), and less likely to be imprisoned (4%), than offenders overall (see Total column in Table 2 above). The 21-30, 31-40, and over 60 years age groups were the most likely to be imprisoned, with 10% of these age groups receiving this penalty. The over 60 years age group was least likely to be fined (21%) and most likely to be dismissed (10%). A high proportion of this age group also received periodic detention (7%).
For many offence groups, the frequencies within each penalty were too small to draw firm conclusions. However, of those with reasonable numbers, some offence groups differed from the overall pattern of penalties. Customs and excise offences were much more likely to be dealt with by a fine (80%) rather than a recognizance (6%), as were prohibited imports / exports (95% and 4%), while the reverse was true for social security offences (41% recognizances, 18% fines) and falsification as a clerk / servant (67% recognizances, 9% fines). The latter being an offence often committed by younger people, it may be that they are less able to afford fines, as are those engaging in welfare fraud. False instrument offences had a relatively severe penalty pattern, with 15% resulting in full time imprisonment.
In general, the overall gender pattern for penalty was maintained within offence groups. However one exception was that of 20 people imprisoned on immigration / passport offences, the majority, 13, were women.
Number of counts
The total number of counts refers to the number of counts for all charges with which a defendant was charged. Principal offence counts refers to the number of counts for the principal offence only. There was an association between the type of penalty, and both the total number of counts and the number of counts for the principal offence. In general, the more severe penalties were associated with higher mean numbers of counts, particularly for the total number of counts. Figure 5 shows these means, with the types of penalty ranked by order of severity.
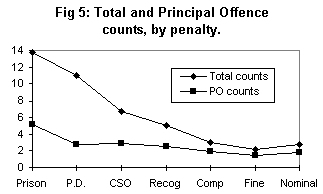
For specific penalties, there were associations between the total number of counts and the duration of sentence, where the penalty was a s.558 recognizance (with and without supervision); a CSO; periodic detention or imprisonment. Again, the higher numbers of counts were associated with longer durations of sentence. While there was not as much variation in the number of principal offence counts, the relationship held for the three latter penalties.
Plea
As around 85% of those convicted of a deception offence had a guilty plea, it is difficult to determine any association between plea and type of sentence. For specific penalties however, the mean duration (or amount if a fine) was higher for those pleading not guilty’ in the case of most penalties. Exceptions were Commonwealth recognizances, CSOs and imprisonment. These categories had similar durations for both pleas. Where the plea had been changed from not guilty’ to guilty’, the mean durations had a similar profile to the guilty’ category.
Age
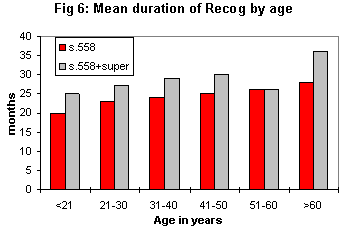
In general, the older the offender was, the more severe the type of penalty. For specific penalties, the data was grouped into six age groups. Durations of s.558 recognizances (with and without supervision) tended to increase with age. Figure 6 shows the mean duration of recognizance for each age group.
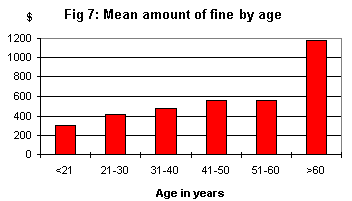
There was also a tendency for fines to increase with age. Figure 7 shows the mean fine for each age group. The very high mean fine in the over 60 years age group was due to a fine of $10,000. This had a large influence on the mean because the numbers in that age group were relatively small. With this value removed, the mean dropped to $479.
Sex
As discussed previously, women were less likely to receive a custodial sentence or a fine. When they did receive a custodial sentence or a fine, it was generally less severe. For example the mean imprisonment term for men was 5 months, but it was 4 months for women. For periodic detention the means were 7 months and 6 months respectively. The mean fine for men was $559, compared with $412 for women. However, where the penalty was any type of recognizance or a CSO, the mean durations were very similar for both sexes.
Part Two of this report will conduct a similar investigation in relation to deception offences dealt with in the higher courts, and draw some more general conclusions about the disposition of such offenders.
| Disclaimer |
|---|
| This paper was prepared by an officer of the Judicial Commission for the information of the Commission and for the information of judicial officers. The views expressed in the report do not necessarily reflect the views of the Judicial Commission itself but only the views of the officer of the Commission who prepared this report for the Commission. |
Footnotes
- The term principal offence’ is defined as the offence which attracted the most severe penalty for the offender.
- The Sentencing Information System justifiably recodes a large proportion of the ‘unknown’ category to no prior record’. For this project however, since there is no way of compensating for underestimating those with a prior record, no recoding was carried out.
| Judicial Commission of New South Wales GPO Box 3634 Sydney 2001 |
Level 5 Wynyard House 301 George Street Sydney 2000 |
Chief Executive Ernest Schmatt |
Tel. (02) 9299 4421 Fax. (02) 9290 3194 |
ISSN 1036 4722


