


Sentencing Deception Offenders
Part 2 – Higher Courts
by
Patricia Gallagher
Senior Research Officer
Introduction
This paper is the second part of a study focussing on sentencing of deception offenders. Part 1 dealt with offenders in the Local Courts jurisdiction,[1] and Part 2 examines data from the higher courts. The types of offences are similar to those dealt with in the Local Courts, but obviously they are more serious, involving greater amounts of money. A summary of the various offences and penalties will be presented, together with a profile of offenders.
Data
The deception offences examined in this paper were identified from court statistics collected for the period 1990-1995. This yielded 5,519 finalised deception charges, resulting in 3,501 convictions, involving 2,048 offenders.
In percentage terms, well over half of all charges (63%) had a ‘guilty’ outcome. Where the accused was female, the figure was 70%. Convictions were almost always by way of a guilty plea (87% for males, 91% for females). In a quarter of cases, either the charge was deemed not appropriate (17%), or no further proceedings were directed (8%). Only 6% of cases had a ‘not guilty’ outcome. The remainder, also 6%, includes cases where, for example, the accused failed to appear, had died, or the case was remitted to the Local Court.
Profile of offences
Deception offences involve a betrayal of trust. Various types of fraud constitute the bulk of these crimes, such as obtaining money or goods by deception and credit card fraud. Forgery and uttering is also common. Less common offences such as bribery and computer crime are also of interest.
Sophisticated crimes such as embezzlement and bankruptcy offences are included. The latter includes attempts to gain from the process of bankruptcy, for example taking on a large debt, or gambling money recklessly, when bankruptcy is imminent.
Immigration and passport offences usually involve persons who are residing or working in Australia illegally, as well as their accomplices. Sometimes Australian or foreign passports are forged, but often people have simply produced false documents or statements in order to procure a passport.
There are a few deception offences which were dealt with solely in the higher courts, including cash transaction banking offences, companies offences, and Commonwealth offences. These would broadly fall into the ‘white collar crime’ category. The latter includes offences by government officers and some currency offences.
Figure 1 displays relative frequencies for all offence groups. As in the Local Courts, obtaining money or goods by deception was the largest category, accounting for 30% of offences. The next largest category was fraud with 21% (compared to just 1% in the Local Courts). The increased presence of this offence in the higher courts would suggest that fraud offences are generally of a serious nature. The smallest group was computer crime, for which there were only 5 cases over the period. Research suggests that computer crime is highly under-reported[2] (particularly where the ‘victim’ is a financial institution) and a lot of criminal activity carried out with the use of computers would actually be prosecuted as fraud.
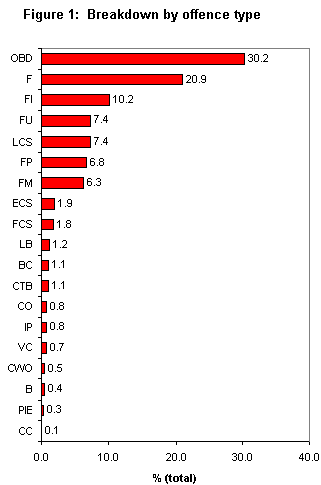
Key to Figure 1
| B | bankruptcy |
| BC | bribery/corruption |
| CC | computer crime |
| CO | companies offence |
| CTB | cash transaction banking |
| CWO | Commonwealth offence |
| ECS | embezzlement clerk/servant |
| F | fraud |
| FCS | falsification by clerk/servant |
| FI | false instruments |
| FM | fraudulent misappropriation |
| FP | false pretences |
| FU | forgery/uttering |
| IP | immigration/passport |
| LB | larceny as bailee |
| LCS | larceny clerk/servant |
| OBD | obtain money/goods by deception |
| PIE | prohibited import/export[3] |
| VC | valueless cheques |
Multiple counts
Almost three quarters of the offences involved only 1 (63%) or 2 (11%) counts. The maximum number however was 159, for a forgery offence. The overall mean count for each offence was 3. There were no differences between female and male offenders. However, there was one company with 4 convictions for fraud and false pretences, which had a mean count of 46.[4]
Offences which resulted in high mean counts were computer crime, Commonwealth offences, embezzlement as clerk / servant, and falsification as clerk / servant, each with a mean of 5.
Profile of offenders
Sex
The breakdown of deception offenders by sex was 79% male, 21% female. This represents a relatively high proportion of female offenders[5] because for all proven offences in the higher courts during the period, the proportion which involved a female offender was just under 10%. Two offences which were more likely to involve a female offender were fraud (29%) and falsification as clerk / servant (33%). No women were convicted of computer crimeor companies offences, and only one woman (3%) was convicted of bribery / corruption.
Age
The overall mean age for deception offenders in the higher courts was 36 years (also the median), with a standard deviation of 11 years. This is somewhat older than deception offenders in the Local Courts – where the mean age was 31 years. Presumably older offenders would tend to have a more persistent and progressive pattern of offending, thereby being more likely to result in an indictable offence. Also, older offenders are more likely to be in senior positions, with access to greater amounts of money.
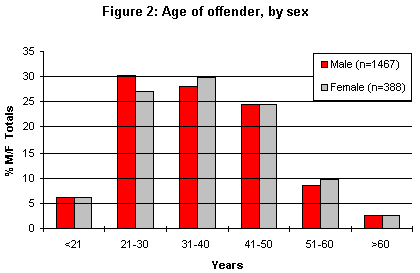
Figure 2 shows the age profile of offenders by sex. Most offenders (60%) were in the 21-40 age group, and the age profile was very similar for both women and men.
Looking at specific offence groups, companies offences had a high mean age, 47 years. Although there were only 6 cases, the range of ages was small with no extreme values to influence the mean. Cash transaction banking andimmigration / passport offences also involved older offenders (40 years). There were no offence groups with particularly young mean ages; the youngest was larceny as a bailee, 31 years.
Prior convictions
Figures for offenders with a prior conviction are probably underestimates, as they only reflect whether there is evidence of a prior conviction, and the information is only available for certain groups of offences in the higher courts data.[6]
Of this sample of deception offenders, 41% definitely had a previous conviction, half of which (427 offenders, 20% of the sample) were for fraud. Of those with a fraud conviction, 40% (172 offenders) had served a prison term for fraud.
As in the Local Courts, women were less likely to have had a prior conviction. Table 1 shows the breakdown of prior convictions by sex of offender.
Table 1: Prior conviction by sex
| Prior conviction | Male | Female | Total |
|---|---|---|---|
| Non-fraud offence | 46% | 21% | 41% |
| Fraud offence | 23% | 11% | 20% |
Sentencing outcomes
Figure 3 shows the relative frequencies of each outcome for males and females, based on their principal offence.[7]
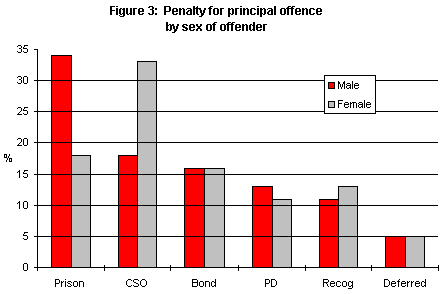
Overall, imprisonment was the most common outcome, with 31% of offenders receiving this penalty. Community Service Orders (CSOs) were also very common (22%). Relatively few offenders received a recognizance (11%), or bond (16%). Only 13 offenders (less than 1%) received a fine for their principal offence. This is in contrast to offences finalised in the Local Courts, where the most common outcomes were recognizances and fines, and reflects the more serious nature of the offences dealt with in the higher courts.
Offence
When examined by offence, the numbers were often insufficient to draw firm conclusions. However, categorising penalties broadly, as either custodial, non-custodial or nominal,[8] a few differences from the overall pattern emerged. For deception offences overall, 44% of offenders received a custodial sentence, 56% a non-custodial one, and less than 1% a nominal sentence. Offences which attracted a more severe penalty were fraudulent misappropriation, false instrument, forgery, and embezzlement as clerk / servant (56%, 55%, 51%, and 51% custodial, respectively). Immigration / passport offences also had 57% receiving a custodial sentence, but this represented only 8 offenders, out of 14.
Offences attracting a more lenient sentencing pattern were cash transaction banking and larceny as bailee (21% and 24% custodial sentences). However there were only 14 and 25 offenders respectively for these offences.
Sex
Women were less likely to receive a prison term than men, but more likely to receive a CSO. This may be related to the earlier finding that women were less likely to have a prior conviction, and therefore would be less likely to receive a prison term.
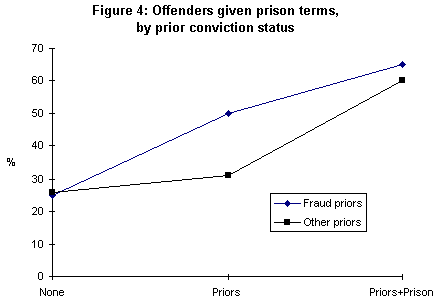
When prior convictions were taken into account, the overall pattern of penalties did not vary notably – imprisonment was still the most common penalty regardless of prior conviction status. However, those with prior convictions were proportionally more likely to receive a prison term, particularly if the conviction(s) had been for fraud. Figure 4 shows the proportions receiving a prison term for (a) offenders with no prior convictions, (b) those with one or more prior convictions but no previous imprisonment, and c) those with at least one prior conviction for which they were imprisoned.
Age
The only age factor evident was that only 15% of offenders under 21 years were given a prison term. They were more likely to receive a bond or probation (25%). The low proportion for imprisonment remained even when the offender had a prior conviction, except where the conviction had been for fraud, or if they had previously been imprisoned.
Plea and number of counts
Almost 90% of the convicted sample pleaded guilty. Women were slightly more likely to plead guilty than men (93% and 88% respectively). As this constitutes almost the entire sample, it was not possible to determine any association between plea and type of sentence.
There was no association between the number of counts and the severity of the penalty. The mean number of counts for most penalties was similar to the overall mean count, 3.
Penalty durations
The medians for each type of penalty are given in table 2 below.
Table 2: Median penalties
| Penalty | Median |
|---|---|
| Imprisonment | 18 months |
| Periodic Detention | 18 months |
| CSO | 300 hours |
| Recognizance | 36 months |
| Bond | 36 months |
| Fine ($) | 2 000 |
Penalty lengths were similar for both sexes, except for imprisonment. The female median terms for imprisonment and periodic detention were 12 months.
Cumulative sentences
If a person received more than one custodial sentence for related offences, in most cases (82%) the sentences would be concurrent. Of the 18% of sentences which were cumulative, more than half were cumulative on an existing sentence being served. Of the 69 offenders who received cumulative sentences, only two were women.
With such a small proportion of sentences being cumulative, differences must be treated with caution. One apparent distinction with these cases was that a higher proportion involved offenders with prior convictions for fraudand/or property offences. Figure 5 shows the proportions of offenders with a prior fraud conviction (‘prior’), and those who had served a prison term for a prior fraud conviction (‘prior with prison’), by the type of penalty received for the current offence(s).
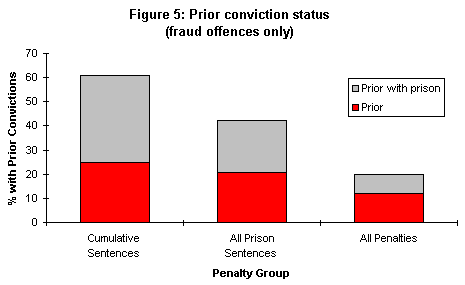
Figure 5 shows that, as mentioned previously, 20% of all deception offenders had a prior conviction for fraud, almost half of whom had served a prison term for fraud. In contrast 61% of offenders given a cumulative sentence (this was only 42 persons) had a previous conviction for fraud, more than half of whom (25 offenders) had served a prison term for fraud. Those who received a custodial sentence – concurrent or cumulative – were between these two extremes. This pattern was particularly pronounced for offenders whose sentence was cumulative on an existing sentence.
The pattern for offenders with prior property offences was very similar to that of fraud, but other offences (for example sexual, driving, assault) had no effect on the penalty.
Conclusion
The annual volume of deception cases in the higher courts was approximately one tenth that of the Local Courts. The main contrast between these jurisdictions is the frequency of fraud cases, which is much greater in the higher courts than in the Local Courts. Also, as one would expect, the greater seriousness and complexity of offences dealt with in the higher courts are reflected in the outcomes and penalty profiles. Although a smaller proportion of cases resulted in a guilty outcome in higher courts, where there was a conviction the most frequently used penalty was imprisonment, whereas in Local Courts the penalty was usually a recognizance or a fine. In both jurisdictions however, there is evidence of some leniency being afforded the younger offender.
Compared with offences other than deception, female offenders figured prominently in both jurisdictions, but were still a minority of offenders. The over-representation of women in offences committed during employment as clerks might suggest that their offending was opportunistic.
| Disclaimer |
|---|
| This paper was prepared by an officer of the Judicial Commission for the information of the Commission and for the information of judicial officers. The views expressed in the report do not necessarily reflect the views of the Judicial Commission itself but only the views of the officer of the Commission who prepared this report for the Commission. |
| Recent Publications: 1996 |
|---|
| Patricia Gallagher, Sentencing Deception Offenders Part 1 – Local Courts, Sentencing Trends, Number 13, June 1996.Anna Johnston and Donna Spears, The Sentencing Act 1989 and its effect on the size of the prison population, Monograph Series, Number 13, 1996.
Ian MacKinnell, The Use of Recognizances, Sentencing Trends, Number 12, May 1996. Ian MacKinnell, “Sentenced to the Rising of the Court”, Sentencing Trends, Number 11, January 1996. |
| Forthcoming Publications |
|---|
| Sentencing Traffic Offenders – A Survey of Magistrates’ Attitudes (Monograph Series).Sentencing Child Sexual Assault Offenders (Monograph Series).
Common Offences in the Local Courts – Update (Sentencing Trends). Gender Disparity in the Sentencing of Juvenile Offenders (Monograph Series). |
| Note: The titles of the forthcoming publications have not yet been finalised. The titles provided indicate the nature of the projects. |
Footnotes
- Gallagher P, Sentencing Deception Offenders Part 1 – Local Courts, Sentencing Trends, No 13, June 1996.
- Smith R, Stealing from Telecommunications, Trends and Issues, No 54, Australian Institute of Criminology, Canberra, April 1996.
- Excluding drug offences.
- As these records only involved 4 offences, they did not unduly influence the overall mean. It remained unchanged with these values removed.
- The higher courts data structure is based on offences rather than offenders. The analysis of offender characteristics was carried out on a person-based subset of the data.
- These data are collected for drug, sexual, fraud, property, violence and driving offences.
- These outcomes are based on each offender’s principal offence. Some offenders would have received other penalties for lesser offences finalised at the same time.
- ‘Custodial’ included imprisonment and periodic detention; ‘non-custodial’ included CSO, recognizance/bond, deferred sentence and fine; ‘nominal’ included sentences to the rising of the court and dismissals.
| Judicial Commission of New South Wales GPO Box 3634 Sydney 2001 |
Level 5 Wynyard House 301 George Street Sydney 2000 |
Chief Executive Ernest Schmatt |
Tel. (02) 9299 4421 Fax. (02) 9290 3194 |
ISSN 1036 4722