|
Sentencing Trends |
||
|
|
An Analysis of New South Wales Sentencing Statistics |
|
|
Published by the Judicial Commission of New South Wales |
||
|
Editor – Ivan Potas – Research Director |
||
|
Number 20 – May 2000 |
||
Sentencing Female Offenders in New South Wales
Patrizia Poletti, Project Officer
Introduction
This issue of Sentencing Trends analyses the types of offences committed by women and the sentences being imposed upon them. It demonstrates how sentencing has changed over time, with particular attention being given to the use of imprisonment as a sanction against women.
The Data
The data upon which this analysis is based were derived from court statistics collected from the Local Courts and higher courts1 of New South Wales for the period 1995 – 1999.2 The statistics depict trial and sentence cases that resulted in a recognised sentencing outcome (eg, imprisonment, fine, recognizance, etc) for a principal offence. The “principal offence” is the offence attracting the severest penalty in a group of offences for which an offender has been convicted. The remaining secondary offences were removed from the data, as were cases that resulted in the imposition of a cumulative sentence.
Overview
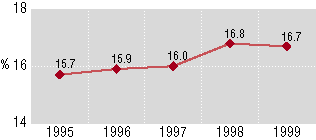
Over the study period, a total of 449,837 cases were examined. Most of these matters were finalised in the Local Courts (437,433 or 97.2%) and most involved male offenders. Women accounted for 16.2% of cases overall (or 72,958 records), but accounted for fewer cases in the higher courts (9.0%). However, as Figure 1 shows, since 1995 the proportion of female offenders to male offenders has increased from 15.7% in 1995 to 16.8% in 1998, although this seems to have stabilised during 1999 to approximately 16.7%.
Figure 1
Percentage of females dealt with by year (1995-1999)
In terms of raw numbers, there was an overall increase in the number of sentencing matters that the courts have dealt with, from 88,992 in 1995 to 96,964 in 1998 (an increase of almost 9%). Most notably, matters involving women have increased at a faster rate than for men (16.3% compared with 7.6% for males).
Nature of Offences
Principal offences were grouped according to the Australian Standard Offence Classification (ASOC).3 The results are presented in Table 1, which compares the frequency of offences for males and females and shows the pattern in the frequency of offences relating to females by sentence year.
Table 1
Frequency of offences for males and females and frequency of offences for females by offence (1995-1999)
| Australian Standard Offence Classification |
FEMALES |
|||||||
| Males | Females | Total | 1995 | 1996 | 1997 | 1998 | 1999 | |
| N=376879 | N=72958 | N=449837 | N=14003 | N=15141 | N=14952 | N=16287 | N=12575 | |
| Offences Against the Person | ||||||||
| Homicide and related offences | 0.1 | 0.1 | 0.1 | 0.1 | 0.1 | 0.2 | 0.2 | 0.1 |
| Acts intended to cause injury | 13.1 | 9.9 | 12.6 | 9.2 | 9.8 | 10.5 | 10.3 | 9.7 |
| Sexual Assault and related offences | 0.7 | 0.0 | 0.6 | 0.0 | 0.0 | 0.1 | 0.0 | 0.0 |
| Dangerous/negligent acts endangering persons | 5.0 | 4.2 | 4.9 | 4.0 | 4.5 | 4.8 | 4.2 | 3.5 |
| Abduction and related offences | 0.0 | 0.0 | 0.0 | 0.0 | 0.0 | 0.0 | 0.0 | 0.0 |
| 19.0 | 14.3 | 18.2 | 13.3 | 14.4 | 15.5 | 14.7 | 13.3 | |
| Offences Relating to Property | ||||||||
| Robbery, extortion and related offences | 0.6 | 0.3 | 0.6 | 0.3 | 0.3 | 0.3 | 0.4 | 0.4 |
| Unlawful entry w/i / burglary, break and enter | 2.3 | 1.0 | 2.1 | 1.0 | 1.2 | 1.1 | 1.0 | 0.9 |
| Theft and related offences | 10.3 | 21.5 | 12.1 | 24.9 | 23.0 | 20.9 | 19.9 | 18.8 |
| Deception and related offences | 2.6 | 6.5 | 3.2 | 6.8 | 6.8 | 6.5 | 6.7 | 5.5 |
| Property damage and environmental pollution | 4.1 | 2.8 | 3.9 | 2.8 | 2.9 | 2.8 | 2.7 | 2.6 |
| 20.0 | 32.1 | 22.0 | 35.8 | 34.2 | 31.6 | 30.6 | 28.2 | |
| Illicit Drug Offences | ||||||||
| Import illicit drugs | 0.1 | 0.1 | 0.1 | 0.0 | 0.0 | 0.0 | 0.1 | 0.1 |
| Deal or traffic in illicit drugs | 1.1 | 1.1 | 1.1 | 1.3 | 1.3 | 1.1 | 0.8 | 0.8 |
| Manufacture or cultivate illicit drugs | 1.5 | 1.5 | 1.5 | 1.7 | 1.7 | 1.6 | 1.3 | 1.2 |
| Possess or use illicit drugs | 5.6 | 5.2 | 5.5 | 4.8 | 4.8 | 4.8 | 5.5 | 6.1 |
| Other illicit drug offences | 0.2 | 0.2 | 0.2 | 0.2 | 0.1 | 0.1 | 0.2 | 0.3 |
| 8.4 | 8.0 | 8.3 | 8.0 | 7.9 | 7.6 | 7.9 | 8.5 | |
| Offences Against Good Order | ||||||||
| Weapons and explosive offences | 1.2 | 0.4 | 1.1 | 0.4 | 0.5 | 0.3 | 0.4 | 0.4 |
| Public order offences | 7.2 | 8.0 | 7.3 | 8.0 | 6.8 | 7.2 | 8.4 | 9.9 |
| Against justice procedures, government | 7.0 | 6.4 | 6.9 | 5.2 | 6.3 | 7.5 | 6.5 | 6.7 |
| 15.4 | 14.8 | 15.3 | 13.6 | 13.6 | 15.0 | 15.3 | 17.0 | |
| Road Traffic and MV Regulatory Offences | ||||||||
| Driving licence offences | 8.0 | 5.3 | 7.6 | 4.3 | 4.3 | 4.6 | 5.9 | 7.7 |
| Registration and roadworthiness offences | 2.0 | 2.2 | 2.0 | 2.6 | 2.3 | 2.6 | 2.0 | 1.7 |
| Regulatory driving offences (eg PCA offences) | 26.3 | 22.1 | 25.6 | 21.8 | 22.4 | 22.1 | 22.2 | 22.1 |
| 36.3 | 29.6 | 35.2 | 28.7 | 28.9 | 29.2 | 30.0 | 31.6 | |
| Other Offences | 1.0 | 1.1 | 1.0 | 0.7 | 1.0 | 1.1 | 1.5 | 1.4 |
The most common offence category was road traffic and motor vehicle regulatory offences,4 accounting for over one-third (35.2%) of all offences dealt with by the courts. It was the most common offence category for males (36.3%) and a close second for females (29.6%). On the other hand, females were more likely than males to be sentenced for offences relating to property (32.1% compared with 20.0% for males), particularly theft5 (21.5% compared with 10.3% for males) and deception6 (6.5% compared with 2.6% of males) offences. Offences against public order7 was another category of offence where proportionately more females were dealt with by the courts (8.0% compared with 7.2% of males).
Trend data
Since 1995 there has been a noticeable drop in the proportion of female offenders sentenced for property offences (from 35.7% in 1995 to 28.2% in 1999). However, there has been an increase in the proportion of women convicted of public order offences8 (from 8.0% in 1995 to 9.9% in 1999), offences against justice procedures, government security and government operations9 (from 5.2% in 1995 to 6.7% in 1999) and driving licence offences10 (from 4.3% in 1995 to 7.7% in 1999).
Sentencing Outcomes and Patterns
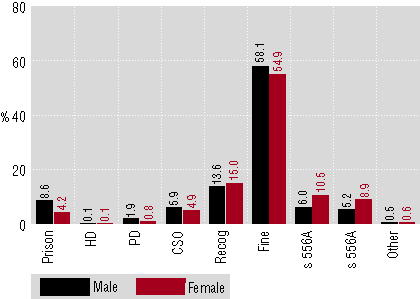
Figure 2 shows the distribution of penalties for males and females over the study period. The majority of offenders (58.1% of males and 54.9% of females) were ordered to pay a fine for their principal offence. Females were less likely than males to receive a full-time prison term (4.2% compared with 8.6% of males). To a lesser extent, females were also less likely to use other alternatives to imprisonment, such as periodic detention and community service orders. Consequently, proportionately more women than men were placed on a recognizance to be of good behaviour, including s 556A11 recognizances or dismissals, which do not require a conviction to be recorded even though the offence may be proven.
Figure 2
Distribution of penalties for males and females (19951999)
Full-time Imprisonment
When examined by year of sentence (see Figure 3), it was found that there was an increase in the use of imprisonment during 1998 for both males and females, but otherwise the rates have been fairly stable over the study period.
Figure 3
Percentage of full-time imprisonment for males and females (1995-1999)
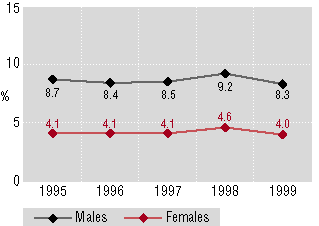
Figure 4 shows the trends in the use of imprisonment for the male and female offenders sentenced by the different courts during the study period. As expected, imprisonment was imposed at a greater rate by the higher courts (60.3%) than by the Local Courts (6.4%). However, it should be noted that the Local Courts imposed the majority (97.2%) of sentences upon convicted offenders.
Figure 4
Percentage of full-time imprisonment for males and females by jurisdiction (1995-1999)
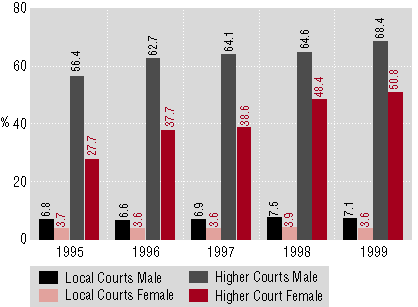
In the higher courts, the use of imprisonment increased in 1996 for males and females, perhaps partly because of the impact of the Criminal Procedure Amendment (Indictable Offences) Act 1995, which commenced on 1 September 1995.12
A recent study by the Judicial Commission13 found that there were significant increases in the number and severity of offences dealt with by the Local Courts. This shift in the practice of the courts has also affected the type and number of matters dealt with by the District Court.14 District Courts are now dealing with more serious cases, partly explaining the increase in the use of imprisonment by that court since 1995.
In the higher courts there was also a significant increase, in 1998, of women who were sentenced to full-time custody. The most likely explanation for this could be the increase in the seriousness of offences being committed by women (eg, armed robbery, driving licence offences, offences against good order and assault) and the accumulation of a criminal record (police programmes having been targeting repeat offenders).
In 1998 in the Local Courts there was an increase in the use of imprisonment for males and females. Although this represents only a small percentage increase, it actually indicates a substantial increase in the number of offenders being imprisoned.
When examined by offence type (see Table 2), it can be seen that for every offence, except import illicit drugs,15 proportionately more males than females received a full-time prison term. This was more likely where the principal offence was a driving offence, an offence against the person (such as dangerous/negligent acts endangering persons and acts intended to cause injury) or an offence relating to property (such as theft).
Table 2
Percentage of full-time imprisonment for males and females and percentage of full-time imprisonment for females by offence (1995-1999)
| Australian Standard Offence Classification |
FEMALES |
|||||||
| Males | Females | Total | 1995 | 1996 | 1997 | 1998 | 1999 | |
| Offences Against the Person | ||||||||
| Homicide and related offences | 62.9 | 39.4 | 59.1 | 46.7 | 31.6 | 48.0 | 48.1 | 8.3 |
| Acts intended to cause injury | 10.2 | 4.0 | 9.4 | 3.8 | 4.3 | 3.8 | 3.9 | 4.4 |
| Sexual Assault and related offences | 44.7 | 33.3 | 44.6 | 33.3 | 100.0 | 9.1 | 42.9 | |
| Dangerous/negligent acts endangering persons | 3.2 | 0.8 | 2.8 | 0.2 | 0.4 | 0.7 | 1.2 | 1.6 |
| Abduction and related offences | 63.8 | 33.3 | 60.4 | 0.0 | 33.3 | 50.0 | 0.0 | |
| 10.0 | 3.5 | 9.2 | 3.2 | 3.5 | 3.4 | 3.8 | 3.7 | |
| Offences Relating to Property | ||||||||
| Robbery, extortion and related offences | 77.0 | 53.9 | 75.0 | 51.4 | 45.0 | 52.5 | 56.9 | 60.9 |
| Unlawful entry w/i / burglary, break and enter | 45.6 | 28.2 | 44.2 | 32.1 | 31.0 | 23.3 | 30.2 | 23.5 |
| Theft and related offences | 16.5 | 6.7 | 13.7 | 5.7 | 5.7 | 7.0 | 7.5 | 8.0 |
| Deception and related offences | 11.6 | 6.0 | 9.8 | 5.4 | 5.3 | 5.4 | 8.4 | 5.2 |
| Property damage and environmental pollution | 4.3 | 2.3 | 4.1 | 2.3 | 3.9 | 2.1 | 1.2 | 1.8 |
| 18.7 | 7.3 | 16.0 | 6.4 | 6.7 | 7.2 | 8.5 | 8.1 | |
| Illicit Drug Offences | ||||||||
| Import illicit drugs | 78.0 | 78.0 | 78.0 | 100.0 | 71.4 | 85.7 | 100.0 | 50.0 |
| Deal or traffic in illicit drugs | 37.2 | 22.7 | 34.8 | 19.0 | 22.1 | 26.4 | 24.0 | 23.1 |
| Manufacture or cultivate illicit drugs | 4.5 | 1.2 | 3.9 | 0.4 | 1.6 | 1.3 | 2.3 | 0.0 |
| Possess or use illicit drugs | 3.2 | 2.0 | 3.1 | 1.8 | 3.0 | 1.4 | 2.2 | 1.4 |
| Other illicit drug offences | 1.7 | 0.9 | 1.6 | 4.5 | 0.0 | 0.0 | 0.0 | 0.0 |
| 8.5 | 5.1 | 8.0 | 4.6 | 6.2 | 5.4 | 5.2 | 3.8 | |
| Offences Against Good Order | ||||||||
| Weapons and explosive offences | 5.7 | 4.1 | 5.6 | 5.0 | 0.0 | 8.5 | 4.6 | 3.8 |
| Public order offences | 2.7 | 0.8 | 2.4 | 0.8 | 1.3 | 0.3 | 1.3 | 0.5 |
| Against justice procedures, government | 16.2 | 10.3 | 15.3 | 14.9 | 9.5 | 8.8 | 11.5 | 7.4 |
| 9.1 | 5.0 | 8.5 | 6.3 | 5.1 | 4.7 | 5.7 | 3.3 | |
| Road Traffic and MV Regulatory Offences | ||||||||
| Driving licence offences | 6.7 | 2.2 | 6.2 | 1.5 | 1.9 | 1.9 | 1.8 | 3.6 |
| Registration and roadworthiness offences | 0.1 | 0.0 | 0.1 | 0.0 | 0.0 | 0.0 | 0.0 | 0.0 |
| Regulatory driving offences (eg PCA offences) | 1.2 | 0.3 | 1.1 | 0.4 | 0.2 | 0.3 | 0.1 | 0.3 |
| 2.3 | 0.6 | 2.1 | 0.5 | 0.5 | 0.5 | 0.4 | 1.1 | |
| Other Offences | 5.2 | 2.8 | 4.8 | 7.3 | 1.4 | 3.1 | 2.1 | 2.3 |
| OVERALL | 8.6 | 4.2 | 7.9 | 4.1 | 4.1 | 4.1 | 4.6 | 4.0 |
Trend data
Table 2 also shows the rate of full-time imprisonment imposed upon female offenders by sentence year and offence type. Since 1995 proportionately more females have been imprisoned for property offences (such as robbery16and theft),17 offences against the person (such as acts intended to cause injury18 and dangerous/negligent acts endangering persons)19 and driving offences.20
Sentence length
Figure 5 shows the median length of prison sentences for males and females that were imposed by the Local and higher courts from 1995 to 1999. In the Local Courts, there has been no change in the median sentence of imprisonment imposed for male (4 months) and female (3 months) offenders.
Figure 5
Median sentence length in months for full-time imprisonment for males and females by jurisdiction (1995-1999)
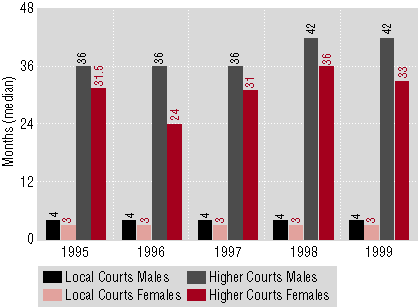
In the higher courts, median sentences of imprisonment have become longer, especially in 1998. For males, it has increased from 36 months in the years prior to 1998 to 42 months since then. For females, it has increased from 31.5 months in 1995 to 36 months in 1998.
Factors Associated with Discrepancies between Males and Females
Why are males (8.6%) twice as likely than females (4.2%) to be given a full-time prison term? And, why do women generally receive shorter sentences than males?
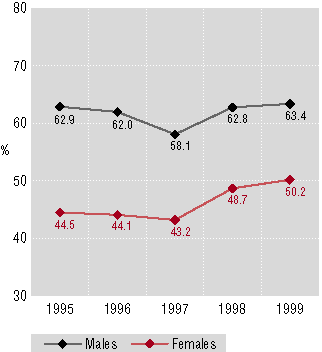
The reason is not likely to be that the courts unfairly discriminate against men, but rather that men tend to commit more serious offences or have a more extensive criminal history. For example, 53.9% of females sentenced by the courts had no prior record of offending compared with 38.2% of males. As Figure 6 shows, the proportion of offenders with a criminal record increased in 1998 for males and females, but at a greater rate for females.21
Figure 6
Percentage of males and females with prior convictions (1995-1999)
Another factor associated with the discrepancy between males and females concerns the severity of the offence. For example, common assault and assault occasioning actual bodily harm fall into the same offence category. Naturally, the percentage of offenders imprisoned was higher for the more serious assault (12.6% for assaults occasioning actual bodily harm and 5.7% for common assault). However, females were less likely than males to commit the more serious assault of occasioning actual bodily harm (1.6% compared with 3.0% of males).
Also, the role of the offender in the commission of the offence may have contributed to differences in the penalties imposed on men and women.22
These and other factors may be the real reasons for differences in the kinds of penalties being imposed for male and female offenders.
Conclusions
This study has shown that over the period 1995 – 1999 –
- the number of sentencing matters coming before the courts significantly increased. This rate of increase was greater for females than for males;
- the proportion of female to male offenders overall increased;
- the proportion of females who were sentenced to full-time imprisonment increased (especially in 1998); and
- the median length of prison terms has remained steady in the Local Courts but increased in the higher courts (especially in 1998).
Many factors may have contributed to the observed patterns in sentencing offenders, both generally and in relation to women, including –
- the impact of the Criminal Procedure (Indictable Offences) Act 1995 –
- as more serious matters were being dealt with by the Local Courts, they attracted more severe penalties (the percentage of offenders imprisoned has gone up for both males and females); and
- as more serious matters were being dealt with by the higher courts, these also attracted harsher penalties (a higher percentage were being sentenced to imprisonment and for longer terms)
- women were committing more serious offences (eg, armed robbery was up while break enter and steal and other property offences were down) which were likely to contribute to the growing size of the prison population – even though these types of offences are relatively rare they attract long prison terms;
- increases in legislative penalties (particularly Traffic Act matters)23 ;
- the impact of guideline sentences (particularly Jurisic24 in relation to dangerous driving and Henry25 in relation to armed robbery); and
- increases in the crime rate (and reporting of crime) and level of police activity (which increased since 199626 and targeted repeat offenders27 ).
Endnotes
| 1 | The term “higher courts” refers to the District and Supreme courts of New South Wales. |
| 2 | Full year data for 1999 was unavailable. Statistics from the Local Courts include cases until September 1999 and higher court statistics include cases until August 1999. |
| 3 | Australian Bureau of Statistics, Australian Standard Offence Classification, 1997, AGPS, Canberra. Note: In this study, the repealed offences of buggery and indecent assault on males (ss 79 and 81 of the Crimes Act 1900, respectively) have been grouped with sexual assault and related offences, and not with offences against public order sexual standards. |
| 4 | Such as exceeding the Prescribed Content of Alcohol limit and driving without a valid licence. |
| 5 | Of which larceny pursuant to s 117 of the Crimes Act 1900 accounted for 79.7% of offences in this category. |
| 6 | Obtaining money by deception, pursuant to s 178BA of the Crimes Act 1900, was the most common offence in this category (accounting for 29.3%) followed by obtain payment of pension/benefit which is not payable, pursuant to s 1347 of the Social Security Act (Commonwealth) 1991 (15.6%) and larceny by clerk or servant pursuant to s 156 of the Crimes Act 1900 (13.7%). |
| 7 | The most common offences in this category were offensive language (36.3%) and offensive behaviour (15.3%) pursuant to s 4 of the Summary Offences Act 1988. Prostitution offences pursuant to ss 19 and 20 Summary Offences Act 1988 accounted for 18.1% of offences in this category and remain or enter inclosed lands pursuant to s 4 of the Inclosed Lands Protection Act 1901 accounted for 14.1%. |
| 8 | See footnote 7. |
| 9 | Such as contravene Apprehended Violence Order pursuant to s 562I(1) Crimes Act 1900, which accounted for 20.1% of offences in this category; resist, hinder etc police officer in execution of duty pursuant to s 546C of the Crimes Act 1900 (17.7%) and fail to furnish required return pursuant to s 8C(1)(a) of the Taxation Administration (Commonwealth) Act 1953 (14.2%). Breaches of justice orders such as fail to appear before the court pursuant to s 51 Bail Act 1978 (10.2%), breach Community Service Order pursuant to s 23(1) of the Community Service Orders Act 1979 (7.4%) [now repealed] and breach condition of recognizance pursuant to s 556B of the Crimes Act 1901 (7.1%) were also common. |
| 10 | Almost half (46.8%) of the offences in this category were drive while licence cancelled pursuant to s 7A(2)(c) Traffic Act 1909 [now repealed]. Drive while unlicensed pursuant to s 6(1)(a) of the Traffic Act 1909 [now repealed] and drive while disqualified pursuant to s 7A(2)(a) Traffic Act 1909 [now repealed] each accounted for around a quarter of offences in this category (25.1% and 22.7% respectively). |
| 11 | Crimes Act 1900, which has now been replaced by s 10 of the Crimes (Sentencing Procedure) Act 1999. |
| 12 | Whereupon Part 9A was inserted into the Criminal Procedure Act 1986, allowing for certain indictable offences (referred to as Table 1 and Table 2 offences) to be dealt with summarily by the local courts. |
| 13 | K Ellson and P Poletti, “Sentencing Offenders in the Local Courts Effects of the Criminal Procedure (Indictable Offences) Act 1995” (2000) 19 Sentencing Trends 1. |
| 14 | The District Court accounts for the majority (97.8%) of higher court sentencing matters. |
| 15 | Pursuant to s 233B of the Customs Act (Commonwealth) 1901. |
| 16 | The most common offences in this category were armed robbery pursuant to s 97 of the Crimes Act 1900 (78.0%) and robbery (by violence/force) pursuant to s 94 of the Crimes Act 1900 (13.8%). |
| 17 | Approximately two-thirds (65.1%) of these offences involved larceny pursuant to s 117 of the Crimes Act 1900. Goods in custody pursuant to s 527C(1) Crimes Act 1900 was next (14.4%). |
| 18 | Mostly common assault pursuant to s 61 of the Crimes Act 1900 (39.2%). Assault occasioning actual bodily harm pursuant to s 59 of the Crimes Act 1900 and assault with intent to commit felony on certain officers pursuant to s 58 of the Crimes Act 1900 each accounted for 21.6% of offences in this category. |
| 19 | Almost one-half (45.8%) of the offences in this category related to driving under the influence pursuant to s 5(2) of the Traffic Act 1909 [now repealed]. Dangerous driving causing grievous bodily harm pursuant to s 52A(3) of the Crimes Act 1900 and driving at a speed/manner dangerous pursuant to s 4(3) of the Traffic Act 1909 [now repealed] each accounted for one-quarter of offences in this category (25.0% each). |
| 20 | Drive while disqualified pursuant to s 7A(2)(a) of the Traffic Act 1909 [now repealed] (54.7%) was by far the most common offence in this category, followed by high range PCA pursuant to s 4E(1G) of the Traffic Act 1909 [now repealed] (21.9%), drive while licence cancelled pursuant to s 7A(2)(c) of the Traffic Act 1909 [now repealed] (12.5%) and mid range PCA pursuant to s 4E(1F) of the Traffic Act 1909 [now repealed] (7.0%). |
| 21 | Perhaps indicative of recidivism and police activity. |
| 22 | See for example, P Gallagher, P Poletti and I MacKinnell, Sentencing Disparity and the Gender of Juvenile Offenders, 1997, Judicial Commission Of New South Wales, Sydney. |
| 23 | On 30 September 1998 the Traffic Amendment (Penalties and Disqualifications) Act 1998 [now repealed] significantly increased the penalties for certain offences. Since then, there has been an increase in the frequency of driving licence offences (Table 1) as well as an increase in the use of imprisonment for these offences (Table 2) for females. |
| 24 | R v Jurisic (1998) 101 A Crim R 259; (1998) 45 NSWLR 209. |
| 25 | R v Henry & ors (1999) 106 A Crim R 149; (1999) 46 NSWLR 346. |
| 26 | In 1996 74% of police were “in the front line”. In 1997 it was 83% and in 1998 it was 85%. See NSW Police Service, 1998-1999 Annual Report. See also NSW Bureau of Crime Statistics and Research, NSW Recorded Crime Statistics: Quarterly Update, June 1999, Media Release, 6 August 1999, which states that “measures of law enforcement activity are significantly higher now than they were two years ago.” |
| 27 | In its media release, the Bureau stated that “the Police have been targeting repeat offenders with the aim of reducing the crime rate. Their tactic has been to arrest repeat offenders even if they only commit relatively minor offences.” See NSW Bureau of Crime Statistics and Research, NSW Criminal Court Statistics 1998, Media Release, 24 September 1999. |
ISSN 1036 4722
Published by the Judicial Commission of New South Wales
| Location: | Level 5, 301 George St, Sydney NSW 2000, Australia |
| Postal address: | GPO Box 3634, Sydney NSW 2001 |
| Telephone: | 02 9299 4421 |
| Fax: | 02 9290 3194 |
| Email: | judcom@judcom.nsw.gov.au |
| Website: | www.judcom.nsw.gov.au |
Disclaimer
This paper was prepared by officers of the Judicial Commission for the information of the Commission and for the information of judicial officers. The views expressed in the report do not necessarily reflect the views of the Judicial Commission itself but only the views of the officers of the Commission who prepared this report for the Commission.


