NUMBER 28 – SEPTEMBER 2003
Common Offences in the Local Court
Jason Keane, Research Officer (Statistics)
Patrizia Poletti, Senior Research Officer (Special Projects)
Introduction
In 1994, the Judicial Commission published Sentencing Trends No 5, “Common Offences in the Local Court”,1which described “the sentencing patterns for the twenty most common offences dealt with in the Local Courts of NSW in 1992”. The present paper contains a similar analysis of offences dealt with in the Local Courts in the calendar year 2002 and compares the current trends and patterns with those observed a decade ago. It provides an overview of both the workload of the court’s criminal jurisdiction and its current sentencing trends and practices, and may serve as an introduction to further study and analysis of sentencing practice in the Local Courts.
DEFINITIONS AND METHODOLOGY
The term “offence” refers to the principal offence for which each offender was sentenced, that is, the offence which attracted the highest penalty. Where an offender was convicted and sentenced for more than one offence, those offences which received lesser penalties were omitted from the analysis. Likewise, cumulative sentences have also been excluded from the study. This is in keeping with the Judicial Commission’s standard practice for analysing sentencing data in the Local Courts, and allows like-for-like comparison of single offences only.It must also be noted that many of the offences, particularly driving and property offences, have different maximum penalties available according to whether the offender has committed a similar offence previously, or according to the value of the property involved. The figures available do not discriminate between offenders within a single offence despite the fact that some are effectively subjected to higher maximum penalties than others.
GENERAL FINDINGS
Volume of offenders
These figures show that while the total number of offenders sentenced has increased from 89,482 in 1992 to 103,004 in 2002 (an increase of around 15.1%), the proportion of those offenders represented by the top twenty offences has remained relatively stable.
The overall increase in the number of cases may reflect an increased population and changes in patterns of criminal offending, or changes in police methods and procedure. The number may also be affected by procedural factors, such as an increase in the number of offences being heard summarily that may have been heard in higher courts in the past, and the movement of particular offences from regulations to an Act. On the other hand, these increases are offset by the movement of offences (for example, traffic offences) from Acts to regulations, which are not recorded in the data set.
In addition, information from the Local Courts is now collected and recorded electronically, whereas at the time of the 1992 study similar information was recorded and analysed manually. Improved efficiency of data recording may also play some part in the increased total of cases seen in 2002.
Table 1: Most common offences sentenced by NSW Local Courts in 2002
| Rank | Offence | Legislation | No of cases |
% of cases |
|
| 2002 |
1992 |
||||
| 1 |
1 |
Mid range PCA | Road Transport (Safety and Traffic Management) Act 1999, s 9(3) | 11,501 |
11.2 |
| 2 |
3 |
Common assault | Crimes Act 1900, s 61 |
7,882 |
7.7 |
| 3 |
4 |
Larceny |
Crimes Act 1900, s 117 |
6,776 |
6.6 |
| 4 |
10 |
Drive while disqualified |
Road Transport (Driver Licensing) Act 1998, s 25A (1) |
4,956 |
4.8 |
| 5 |
2 |
High range PCA |
Road Transport (Safety and Traffic Management) Act 1999, s 9(4) | 4,864 |
4.7 |
| 6 |
9 |
Low range PCA | Road Transport (Safety and Traffic Management) Act 1999, s 9(2) | 4,818 |
4.7 |
| 7 |
5 |
Possess prohibited drug |
Drug misuse and Trafficking Act 1985, s 10(1) |
4,098 |
4.0 |
| 8 |
8 |
Malicious destruction/damage |
Crimes Act 1900, s 195(a) |
3,873 |
3.8 |
| 9 |
– | Knowingly contravene AVO |
Crimes Act 1900, s 562I |
3,214 |
3.1 |
| 10 |
– | Drive while suspended |
Road Transport (Driver Licensing) Act 1998, s 25A (2) |
3,143 |
3.1 |
| 11 |
12 |
Assault occassioning bodily harm |
Crimes Act 1900, s 59(1) |
3,090 |
3.0 |
| 12 |
– | Drive without being licensed |
Road Transport (Driver Licensing) Act 1998, s 25 (1) |
2,745 |
2.7 |
| 13 |
– | Negligent driving (not causing death or GBH) |
Road Transport (Safety and Traffic Management) Act 1999, s 42 (1)(c) | 2,263 |
2.2 |
| 14 |
– | Drive unregistered vehicle |
Road Transport (Vehicle Registration) Act 1997, s 18 (1) |
2,127 |
2.1 |
| 15 |
6 |
Drive while licence refused/cancelled |
Road Transport (Driver Licensing) Act 1998, s 25A (3) |
2,071 |
2.0 |
| 16 |
– | Assault with intent on certain officers |
Crimes Act 1900, s 58 |
2,068 |
2.0 |
| 17 |
20 |
Goods in custody |
Crimes Act 1900, s 527C(1) |
2,009 |
2.0 |
| 18 |
7 |
Offensive language |
Summary Offences Act 1988, s 4A |
1,982 |
1.9 |
| 19 |
11 |
Offensive conduct |
Summary Offences Act 1988, s 4 |
1,836 |
1.8 |
| 20 |
15 |
Break, enter and steal |
Crimes Act 1900, s 112(1) |
1,342 |
1.3 |
| TOTAL FOR TOP TWENTY CASES | 76,658 |
74.4 | |||
| ALL REMAINING OFFENCES | 26,346 |
25.6 | |||
| TOTAL | 103,004 |
100.0 |
|||
Comparing the top twenty offences: 1992 and 2002
The six offences which appeared in 1992 but which do not appear in the 2002 list (with positions in the 1992 list shown in parentheses), were:
- (13) Cultivate prohibited plant: Drug Misuse and Trafficking Act 1985, s 23(1)(a)
- (14) Drive speed/manner dangerous: Traffic Act 1909, s 4(1) [repealed]
- (16) Steal from person: Crimes Act 1900, s 94
- (17) Resist police: Crimes Act 1900, s 546C
- (18) Use prohibited drug: Drug Misuse and Trafficking Act 1985, s 12(1)
- (19) Supply prohibited drug: Drug Misuse and Trafficking Act 1985, s 25(1).
Interestingly, three of the six offences to have dropped out of the top twenty in the intervening
decade were offences under the Drug Misuse and Trafficking Act 1985. As a result, only one drug-related offence remains in the top twenty for 2002. This may indicate that alternative procedures such as the cannabis cautioning scheme and the move towards therapeutic jurisprudence may be impacting on the number of drug offenders appearing in the Local Courts.
Also of interest are the offences of offensive language and offensive conduct. These offences appear in both lists, but in 2002 they had both moved from the middle to the foot of the table. This may indicate both changing social values (in terms of what constitutes “offensive” conduct or language) and more tolerant police or prosecution policies relating to these offences.
PARTICULAR OFFENCES
Prescribed concentration of alcohol (PCA) offences3
In total, the three PCA offences account for 21,183 offenders sentenced, or 20.6% of all offenders sentenced by the Local Courts in 2002. By comparison, the 1992 figures showed that an almost identical number of offenders were sentenced for these three offences (21,848), but this represented 24.5% of all offenders sentenced. This proportional decease in PCA offenders in 2002 is particularly evident in the high range offence, which has reduced in real terms from 7663 offenders (2nd position in the top twenty in 1992) to 4864 offenders (5th position) in 2002. The proportional decease in PCA offences and the actual decrease in high-range offenders tend to indicate that the principle of deterrence and the many programs instituted in the past decade to modify driver behaviour in relation to alcohol consumption may be having a positive effect.
Driving, licensing and vehicle registration offences
In all, the six vehicle/licensing offences accounted for 17,305 offenders, or 16.8% of all persons sentenced by the Local Courts in 2002. When this is combined with the number of PCA offenders, it can be seen that 39,153 offenders were sentenced for an offence relating to the use and operation of a motor vehicle, which accounts for at least 38.0% of all offenders sentenced by the Local Courts in 2002.5
Offences against the person
The third offence in this group was “assault with intent to commit a serious indictable offence upon certain officers”6 which was ranked 16th. This offence did not appear in the 1992 list of common offences, but interestingly it appears at a similar position as the offence of “resist police”7 which ranked 17th in the 1992 table. The offence under s 546C has not been repealed in the intervening decade, perhaps indicating that the offence has fallen out of favour with police and/or prosecuting authorities, and charges under s 58, which carry a significantly greater maximum penalty, are now being prosecuted, whereas similar conduct in the past may have resulted in a prosecution under s 546C.8
Property offences
Drug offences
Other offences
The final offence of “knowingly contravene apprehended violence order (AVO)” appeared in 9th position and accounted for 3214 offenders (3.1%). This offence did not appear in the 1992 list.
PENALTIES AND SENTENCES
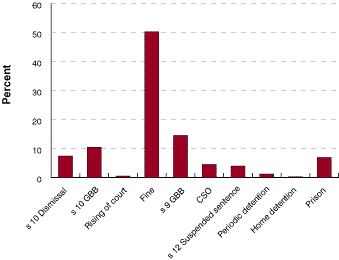
- Fines: Just over half of all offenders (50.2%) were punished by way of fine only. The median fine amount imposed was $400, compared to $300 in 1992. The most common fine amount was $500, which was imposed on 13.8% of offenders who were fined. The majority of fines (56.7%) were in the range of $200 to $500. This is a smaller proportion of fine outcomes than was found in 1992 (62.6%), but fines remain the most common outcome for criminal offences in the Local Courts.
- Good behaviour bonds (GBBs) under s 9 of the Crimes (Sentencing Procedure) Act 199910 were the next most commonly used penalty (14.5%). The median bond duration was 12 months. Most of these bonds were unsupervised (60.4%), while 39.6% of offenders were supervised by the Probation and Parole Service while serving their bonds.
- Dismissals without conviction under s 10 of the Crimes (Sentencing Procedure) Act 1999 were recorded for 17.8% of all offenders. This included 7.4% where the dismissal was outright and 10.4% where a good behaviour bond was imposed. Where a bond was ordered, the median duration of the bond was 12 months.
- Community service orders (CSOs) accounted for 4.5% of offenders. The median length for CSOs imposed was 100 hours.
- Suspended sentences under s 12 of the Crimes (Sentencing Procedure) Act 1999 accounted for 4.0% of penalties imposed. The median length of the suspended sentences was nine months.
- Full time imprisonment: Among the custodial sentences, full time imprisonment was imposed on 6.9% of offenders, with a median sentence length of six months. This compares to an imprisonment rate of 5.6% in 1992. While not appearing to be a large change overall, it is in fact a significant increase when the number of persons imprisoned is considered. Based on these figures, the number of persons imprisoned by the Local Courts rose from approximately 5000 in 1992 to 7088 in 2002, an increase of approximately 40%.
- Periodic detention (PD) was imposed sparingly (1.2% of offenders) and the median term of detention was six months.
- Home detention (HD) was rarer still, being imposed on 0.3% of offenders, with a median detention period of six months.
- Rising of the court (ROC): Only 0.5% of the offenders were sentenced until the rising of the court.
Figure 1: Distribution of sentence types for offenders sentenced in the Local Courts 2002
The most noticeable changes in the present sentencing pattern compared to those observed for 1992 were the substantial decrease in the proportion of offenders who were fined, down from 62.6% in 1992 to 50.2% in 2002. However, where fines were imposed, the amounts of the fines tended to be higher than was the case in 1992, which may be attribtable to increased maximum fine amounts for many offences.11
The 2002 rates of imprisonement (5.6% in 1992), CSOs (5.5% in 1992) and PD (<1.0% in 1992) were similar to their corresponding levels in 1992. Therefore, the decrease in the proportion of fine-only outcomes can be apportioned to the introduction of suspended sentences12 and the increase in dismissals without conviction which accounted for 17.8% of offenders sentenced in 2002 compared to approximately 11.0% in 1992.
Despite these changes in the distribution between penalty types, what remains clear is that the Local Courts in 2002 — as was the case in 1992 — rarely imposed custodial sentences, while relying heavily on fines and various bonds as penalty options.
Penalties for the twenty most common offences
Table 2: Most common offences sentenced in NSW Local Courts in 2002 — Distribution of penalty type
Penalty type (%) |
|||||||||||
| Rank | Offence description | s 10 Dism |
s 10 GBB |
ROC |
Fine |
s 9 GBB |
CSO |
s 12 Susp |
PD |
HD |
Prison |
| 1 |
Mid range PCA |
5.0 |
21.6 |
0.1 |
63.0 |
6.7 |
2.1 |
0.6 |
0.3 |
0.0 |
0.6 |
| 2 |
Common assault |
6.8 |
14.8 |
0.5 |
28.6 |
32.5 |
4.1 |
5.3 |
0.9 |
0.1 |
6.3 |
| 3 |
Larceny |
7.7 |
11.5 |
0.8 |
43.1 |
16.1 |
3.3 |
5.5 |
1.0 |
0.3 |
10.6 |
| 4 |
Drive while disqualified |
0.6 |
2.6 |
0.2 |
21.8 |
17.4 |
17.4 |
13.1 |
6.5 |
1.7 |
18.8 |
| 5 |
High range PCA |
1.0 |
10.4 |
0.1 |
59.3 |
17.5 |
4.7 |
2.7 |
1.1 |
0.3 |
2.9 |
| 6 |
Low range PCA |
13.4 |
31.0 |
0.1 |
54.1 |
1.4 |
0.0 |
No custodial penalty available |
|||
| 7 |
Possess prohibited drug |
8.4 |
7.4 |
2.1 | 67.8 |
9.4 |
0.8 |
0.8 |
0.2 |
0.0 |
3.0 |
| 8 |
Malicious destruction/damage |
10.4 |
11.0 |
0.8 |
48.6 |
18.8 |
3.3 |
2.1 |
0.6 |
0.1 |
4.2 |
| 9 |
Knowingly contravene AVO |
6.5 |
7.4 |
1.9 | 27.9 |
29.9 | 4.7 | 9.1 | 1.2 |
0.1 |
11.2 |
| 10 |
Drive while suspended |
8.2 |
15.2 |
0.0 |
63.8 |
7.8 |
2.9 |
0.8 |
0.4 |
0.1 |
0.8 |
| 11 |
Assault occassioning actual bodily harm |
2.3 |
10.1 |
0.3 |
16.6 |
37.1 |
8.9 |
8.9 |
2.8 |
0.0 |
12.9 |
| 12 |
Drive without being licensed |
8.6 |
2.7 |
0.1 |
83.4 |
3.2 |
1.0 |
No custodial penalty available | |||
| 13 |
Negligent driving(not causing death/GBH) |
21.2 |
2.3 |
0.0 |
75.9 |
0.3 |
0.0 |
No custodial penalty available | |||
| 14 |
Drive unregistered vehicle |
19.1 |
0.7 |
0.2 |
79.5 |
0.2 |
0.1 |
No custodial penalty available | |||
| 15 |
Drive while licence refused/cancelled |
3.6 |
8.8 |
0.1 |
55.9 |
15.5 |
7.1 |
4.4 |
1.4 |
0.4 |
2.8 |
| 16 |
Assault with intent on certain officers |
3.8 |
8.2 |
0.8 |
40.5 |
25.7 |
5.3 |
5.8 |
0.8 |
0.1 |
9.1 |
| 17 |
Goods in custody |
3.5 |
5.5 |
1.4 |
42.0 |
21.4 |
4.6 |
4.7 |
1.4 |
0.4 |
15.0 |
| 18 |
Offensive language |
15.2 |
3.0 |
0.5 |
80.3 |
0.8 |
0.2 |
No custodial penalty available | |||
| 19 |
Offensive conduct |
19.1 |
7.1 |
0.7 |
68.5 |
3.4 |
0.3 | 0.1 |
0.1 |
0.0 |
0.7 |
| 20 |
Break, enter and steal |
0.7 |
1.9 |
0.6 |
1.6 |
18.2 |
10.4 |
15.5 |
4.7 |
0.9 |
45.5 |
| All remaining offences | 7.6 |
6.0 |
0.6 |
50.4 |
13.7 |
5.8 |
4.8 |
1.4 |
0.4 |
9.4 |
|
| TotalL |
7.4 |
10.4 |
0.5 |
50.2 |
14.5 |
4.5 |
4.0 |
1.2 |
0.3 |
0.3 | |
1. Mid range PCA
Most offenders (63.0%) were dealt with by way of fine only, with a median of $600 and a mode of $500. Over three-quarters of fines (78.9%) were in the range of $400 to $1000.
Of the remaining offenders, 26.6% were dismissed without conviction under s 10 of the Crimes (Sentencing Procedure) Act 199914 (21.6% of those with GBB and 5.0% without). A further 6.7% received s 9 GBB, and 2.1% received CSO.
Only 0.6% of offenders were imprisoned, with the median sentence imposed being six months. There were similar small proportions of s 12 suspended sentences (0.6%) and PD (0.3%) imposed. There were negligible numbers of offenders sentenced to home detention (four offenders) and ROC (0.1%).
Licence disqualification: 73.3% of offenders were disqualified from holding a driver’s licence. The median disqualification period was seven months, and the most common period was six months (47.5% of those disqualified). A further 20.1% were disqualified for 12 months.
2. Common assault
For this offence the most common penalty imposed was a s 9 GBB (32.5% of offenders), followed by a fine (28.6%). The median fine amount imposed was $400 and the mode was $500. Section 10 dismissals were also common, with 14.8% of offenders dismissed with GBB and 6.8% without. Other penalties for this offence included s 12 suspended sentences (5.3%), CSOs (4.1%), PD (0.9%), HD (0.1%) and ROC (0.5%).
The imprisonment rate for this offence was 6.3% with a median sentence length of four months. Both the imprisonment rate and median prison sentence for this offence were approximately half of those for the offence of “assault occasioning actual bodily harm”: see below at no 11 on list.
3. Larceny
Most offenders (43.1%) were dealt with by way of fine only, with a median and mode fine amount of $300. Almost three-quarters (72.5%) of fines were in the range of $200 to $500. Of the remaining offenders, 19.2% received a dismissal without conviction under s 10 (11.5% with GBB and 7.7% without). A further 16.1% received s 9 GBB, and 3.3% received CSO.
Larceny was one of only six offences among the top twenty with an imprisonment rate of over 10% (10.6%), and the median sentence length was four months. In addition, 5.5% of offenders received s 12 suspended sentences, and there were small percentages of PD (1.0%), HD (0.3%) and ROC (0.8%).
4. Drive while disqualified
The sentencing pattern for this offence was different to most others in the top twenty. It had one of the lowest rates of fine-only outcomes (21.8%: median $800, mode $1000), and the second highest proportion of custodial sentences (18.8%: median and mode sentence six months).
In accordance with those generally harsher penalties, there was also increased use of s 9 GBB (17.4%), s 12 suspended sentences (13.1%), CSO (17.4%), PD (6.5%) and HD (1.7%) when compared to the overall sentencing figures. The levels of s 10 dismissals (2.6% with GBB and 0.6% without) and ROC outcomes (0.2%) were both lower than the overall figures.
Licence disqualification: 95.7% of offenders were disqualified from holding a driver’s licence. The median disqualification period was two years, which was also the most common period imposed (72.8% of those disqualified).
5. High range PCA
While this offence carries the same maximum penalties as “drive while disqualified”, the sentencing pattern is very different, being much more in accordance with the overall Local Courts sentencing figures for 2002. Fines were again the most common penalty imposed (59.3%), although the median fine of $1000 was high when compared to the overall median fine of $400. Over three-quarters of all fines (76.6%) were in the range of $500 to $1500, and the most common fine amount was $1000.
The next most common outcome was a s 9 GBB (17.5%), followed by s 10 dismissal (10.4% with GBB and 1.0% without). Other penalties were used sparingly: CSOs (4. 7%), s 12 suspended sentences (2.7%), PD (1.1%) and HD (0.3%). Only three offenders were sentenced to ROC.
The imprisonment rate was 2.9%, with a median sentence of seven months.
Licence disqualification: 88.3% of offenders were disqualified from holding a driver’s licence. The median disqualification period was 18 months, and the most common period was 12 months (38.8% of those disqualified).
6. Low range PCA
Fines were the most common penalty for this offences (54.1%), with a median amount of $400, but as may be expected, the overall sentencing pattern was more lenient than for high or mid-range PCA offences. Common fine amounts were $300 (17.2% of fines), $400 (16.3%) and $500 (14.1%), and 71.9% of fines were in the range of $300 to $600.
Leniency is further reflected in the very high rates of dismissal without conviction, with 44.4% of offenders dealt with under s 10 (31.0% with GBB and 13.4% without). Other penalty types were rare, with 1.4% of offenders sentenced to s 9 GBB, two offenders sentenced to CSO and three offenders sentenced to ROC.
As there is no custodial punishment available for this offence, there were no offenders sentenced to imprisonment, s 12 suspended sentences, PD or HD.
7. Possess prohibited drug
This offence recorded a very high proportion of fine outcomes, with more than two-thirds of all offenders being sentenced in this way (67.8%). The median fine amount was quite low at $250 and the mode amount was $200. Almost two-thirds of fines (65.4%) were in the range of $100 to $300. The next most common outcome was a s 10 dismissal (7.4% with GBB and 8.4% without) followed by a s 9 GBB (9.4%). Other penalties were used sparingly: CSO (0.8%), s 12 suspended sentences (0.8%), PD (0.2%) and ROC (2.1%). Only one offender was sentenced to HD.
The imprisonment rate was 3.0%, with a low median of two months.
8. Malicious destruction/damage
This offence displayed a “typical” sentencing pattern, with all penalties being used about as frequently as shown in the overall Local Courts sentencing figures. Fines accounted for 48.6% of offenders sentenced, with a median fine amount of $300. Most common fine amounts were $200 (15.5% of fines), $300 (15.7%) and $400 (15.3%). Almost three-quarters of fines (72.6%) were in the range of $200 to $500.
The next most common outcome was a s 10 dismissal (11.0% with GBB and 10.4% without), followed by a s 9 GBB (18.8%). Other penalties imposed included CSOs (3.3%), s 12 suspended sentences (2.1%), PD (0.6%), HD (0.1%) and ROC (0.8%).
The imprisonment rate was 4.2%, with a median sentence of three months.
9. Contravene apprehended violence order
This offence displayed an atypical sentencing pattern with a relatively low proportion of fines (27.9%, median fine amount $300, mode $500), and relatively high proportions of imprisonment (11.2%, median sentence 4.5 months), s 9 GBB (29.9%) and s 12 suspended sentences (9.1%).
Dismissals under s 10 accounted for 13.9% of outcomes (7.4% with GBB and 6.5% without) and 1.9% of offenders were sentenced to ROC. Other outcomes were CSO (4.7%), PD (1.2%) and HD (0.1%).
10. Drive while suspended
Although this offence carries identical maximum penalties as the offence of “drive while disqualified”, it is sentenced very differently by the Local Courts. Whereas “drive while disqualified” showed a low rate of fines and a high rate of imprisonment, the opposite is true for “drive while suspended”, with 63.8% of offenders fined (median and mode fine amount $500) and only 0.8% of offenders imprisoned (median sentence three months). The majority of fines (87.5%) were in the range of $300 to $1000.
Of the remaining offenders, 23.4% received a dismissal without conviction under s 10 (15.2% with GBB and 8.2% without), 7.8% received s 9 GBB, while CSO (2.9%), s 12 suspended sentences (0.8%), PD (0.4%), HD (0.1%) and ROC (one offender) were imposed only occasionally.
Licence disqualification: 76.4% of offenders were disqualified from holding a driver’s licence. The median disqualification period was 12 months, which was also the most common period imposed (75.9% of those disqualified). A further 19.4% were disqualified for two years.
11. Assault occasioning actual bodily harm
This offence had the second lowest level of fine outcomes (16.6%, median fine amount $600, mode $500) and the fourth highest rate of imprisonment (12.9%, median sentence nine months) among offences in the top twenty for 2002.
The most common outcome was s 9 GBB (37.1%: median bond duration 18 months). Other outcomes included s 10 dismissals (10.1% with GBB and 2.3% without), CSO (8.9%), s 12 suspended sentences (8.9%), PD (2.8%) HD (one offender) and ROC (0.3%).
12. Drive without being licensed
This offence had the highest level of fine outcomes (83.4%, median fine amount $400, mode $500). Around two-thirds of fines (66.1%) were in the range of $200 to $500.
With such a high proportion of fines, there were only small proportions of other penalty types. Dismissals under s 10 accounted for 11.2% of offenders (2.7% with GBB and 8.6% without), while s 9 GBB (3.2%), CSO (1.0%) and ROC (0.1%) were used sparingly.As there is no custodial penalty available for this offence, there were no offenders sentenced to imprisonment, s 12 suspended sentences, PD or HD.
Licence disqualification: 29.0% of offenders were disqualified from holding a driver’s licence. The median disqualification period was 18 months, and the most common period imposed was three years (43.3% of those disqualified). A further 20.3% were disqualified for 12 months.
13. Negligent driving (not causing death or grievous bodily harm)
This offence carried one of the lightest maximum penalties among those represented in the twenty most common offences. Fines accounted for just over three-quarters of all outcomes (75.9%: median and mode fine amount $200). Most fines (88.5%) were in the range of $100 to $500.
Section 10 dismissals accounted for almost all remaining offenders (2.3% with GBB and 21.2% without). Of the handful of other offenders, seven (0.3%) received s 9 GBB, one received a CSO and one was sentenced to ROC.
As there is no custodial penalty available for this offence, there were no offenders sentenced to imprisonment, s 12 suspended sentences, PD or HD.
14. Drive unregistered vehicle
The sentencing pattern for this offence was similar to that observed for the offence of “negligent driving not causing death/GBH”, with fines accounting for 79.5% of offenders sentenced (median fine amount $300, mode $400). The vast majority of fines (90.5%) were in the range of $100 to $500, again a very similar distribution to the offence of “negligent driving not causing death/GBH”.
Section 10 dismissals (0.7% with GBB and 19.1% without) accounted for nearly all remaining offenders sentenced. All other available penalty types (CSO, s 9 GBB and ROC) when combined accounted for only half of 1% of offenders.
As there is no custodial punishment available for this offence, there were no offenders sentenced to imprisonment, s 12 suspended sentences, PD or HD.
Licence disqualification: Only 0.6% of offenders were disqualified from holding a driver’s licence. The median disqualification period was 12 months, which was also the most common period imposed (46.2% of those disqualified).
15. Drive while licence refused/cancelled
This offence carries the same maximum penalties as “drive while disqualified” (4th position in the list) and “drive while suspended” (10th position in the list), and its sentencing pattern fits somewhere between those two offences.
Over half of all offenders convicted of this offences were fined (55.9%, median and mode fine amount $500). The majority of fines (83.9%) were in the range of $300 to $1000. The next most frequent outcome was s 9 GBB (15.5%). CSO were also imposed more frequently than overall (7.1% of offenders). Of the remaining offenders, 12.5% were dismissed without conviction under s 10 (8.8% with GBB and 3.6% without), while 4.4% of offenders received s 12 suspended sentence. Other outcomes included PD (1.4%), HD (0.4%) and ROC (0.1%).The rate of imprisonment was 2.8% and the median term imposed was six months.
Licence disqualification: 87.2% of offenders were disqualified from holding a driver’s licence. The median disqualification period was 24 months, which was also the most common period imposed (54.8% of those disqualified). A further 37.2% were disqualified for 12 months.
16. Assault with intent on certain officers
When compared to the overall sentencing figures, this offence showed a lower rate of fine outcomes (40.5%, median fine amount $400, mode $500) and higher rates of both imprisonment (9.1%, median sentence four months) and s 9 GBB (25.7%). Almost three-quarters of fines (71.0%) were in the range of $200 to $500.
Other outcomes included s 10 dismissals (8.2% with GBB and 3.8% without), CSO (5.3%), s 12 suspended sentences (5.8%), PD (0.8%), HD (0.1%) and ROC (0.8%).
17. Goods in custody
This offence showed the third highest rate of imprisonment (15.0%), although the median sentence was quite low at three months. Fines were the most common outcome (42.0%, median fine amount $400, mode $500). The majority of fines (82.5%) were in the range of $200 to $500. Other outcomes included s 9 GBB (21.4%), s 10 dismissals (5.5% with GBB and 3.5% without), CSO (4.6%), s 12 suspended sentences (4.7%), PD (1.4%), HD (0.4%) and ROC (1.4%).
18. Offensive language
This offence carries the lightest penalty of any of the twenty most common offences in the Local Courts, and this is reflected in the sentences imposed. Fines (80.3%: median fine amount $200, mode $100) and s 10 dismissals (3.0% with GBB and 15.2% without) accounted for nearly all offenders sentenced. Almost three-quarters of fines (72.6%) were in the range of $100 to $300. Other outcomes included s 9 GBB (0.8%), CSO (0.2%) and ROC (0.5%). As there is no custodial punishment available for this offence, there were no offenders sentenced to imprisonment, s 12 suspended sentences, PD or HD.
19. Offensive conduct
Aside from the 13 offenders imprisoned (0.7%, median sentence one month), the major differences between sentencing for this offence and for “offensive language” was that even more offenders were dismissed without conviction under s 10 (7.1% with GBBs, 19.1% without). This meant that fines, while still representing the majority of offenders (68.5%, median and mode fine amount $200) were less common than for the offence of “offensive language”. Again, almost three-quarters of fines (71.5%) were in the range of $100 to $300.
20. Break, enter and steal
This offence carries the harshest maximum penalty of any of the offences in the top twenty, and this is reflected in the sentencing outcomes. The imprisonment rate of 45.5% is far greater than for any other offence (the next highest being 18.8%), and the median sentence of 12 months is double the overall median sentence. There were also higher than average proportions of s 9 GBB (18.2%), s 12 suspended sentences (15.5%), CSO (10.4), PD (4.7%) and HD (0.9%).
The corollary of this is a very low proportion of s 10 dismissals (1.9% with GBB, 0.7% without) and fine outcomes (1.6%, median fine amount $800).
All remaining offences
For all remaining offences sentenced in the Local Courts in 2002, the outcomes were as follows: imprisonment (9.4%, median sentence seven months), fines (50.4%, median fine amount $400, mode $500), s 10 dismissal with GBB (6.0%), s 10 dismissal without GBB (7.6%), s 9 GBB (13.7%), CSO (5.8%), s 12 suspended sentences (4.8%), PD (1.4%), HD (0.4%) and ROC (0.6%).
CONCLUSION
Coupled with this decrease in fines has been a slight increase in the rate of full-time custodial sentences imposed (from 5.6% in 1992 to 6.9% in 2002). The figures also show an increase in dismissals without conviction under s 10 (from approximately 11.0% in 199215 to 17.9% in 2002) and an increased reliance on bonds of all kinds. Over one-quarter of all offenders sentenced by the Local Courts (28.9%) were ultimately subjected to a good behaviour bond, either under s 9 (14.5% or 14,978 offenders), s 10 (10.4% or 10,718 offenders), or s 12 in conjunction with a suspended sentence (4.0% or 4,149 offenders).
The Sentencing Council of NSW will, in the near future, be studying sentences of less than six months duration with the intention of recommending whether such sentences should be abolished. The present analysis shows that in 2002, 3955 offenders received custodial sentences of six months or less. While this represents only 3.8% of all offenders sentenced in the Local Courts, this figure also represents the majority (55.8%) of all offenders who were imprisoned by the Local Courts. This figure becomes even greater if suspended sentences, HD and PD sentences of six months or less duration are included.
Endnotes
1 I MacKinnell, “Common Offences in the Local Court” (1994) 5 Sentencing Trends, Judicial Commission of NSW.
2 Data recorded and supplied by the NSW Bureau of Crime Statistics and Research.
3 For a full discussion of recent trends in drink-driving offences sentenced in the Loca Courts see C Bayari, “Sentencing Drink-Driving Offenderds in the NSW Local Court” (2003) 27 Sentencing Trends, Judicial Commission of NSW; for earlier analysis see I MacKinnell, “Sentencing Drink-Driving Offenders” (1995) 10 Sentencing Trends, Judicial Commission of NSW.
4 The offence of “drive in manner/speed dangerous” (Traffic Act 1909, s 4(1)) appeared in the 1992 list at position 14, but this is not the same substantive offence as “negligent driving not causing death or grievous bodily harm” (Road Transport (Safety and Traffic Management) Act 1999, s 42(1)(c)) that appears at position 13 of the 2002 list.
5 Not including any other driving/licensing or PCA offences outside the twenty most common offences.
6 Crimes Act 1900, s 58.
7 Crimes Act 1900, s 546C.
8 In 2002 there were still 631 offenders (0.6%) sentenced for offences under s 546C of the Crimes Act.
9 The three other drug offences which appeared in the 1992 list but were outside the twenty most common offences in 2002, still accounted for 1565 offenders (1.5%).
10 All subsequent references to s 9 good behaviour bonds refer to this Act and section.
11 For example, in 1998 the maximum fines for various driving and PCA offences were increased dramatically, in some cases by as much as 200 and 300%: Traffic Amendment (Penalties and Disqualifications) Act 1998.
12 Crimes (Sentencing Procedure) Act 1999, s 12.
13 Currently, 1 penalty unit equals $110: Crimes (Sentencing Procedure) Act 1999, s 17.
14 All susequent references to s 10 dismissals refer to this Act and section.
15 Compared to the previous dismissal outcomes under s 556A of the Crimes Act 1900.
ISSN 1036 4722
Published by the Judicial Commission of New South Wales
Location: Level 5, 301 George St, Sydney NSW 2000, Australia
Postal address: GPO Box 3634, Sydney NSW 2001
Telephone: 02 9299 4421
Fax: 02 9290 3194
Email: judcom@judcom.nsw.gov.au
Website: www.judcom.nsw.gov.au
Disclaimer
This paper was prepared by officers of the Judicial Commission for the information of the Commission and for the information of judicial officers. The views expressed in the report do not necessarily reflect the views of the Judicial Commission itself but only the views of the officers of the Commission who prepared this report for the Commission.


