Introduction
This Sentencing Trends & Issues tackles the continuing issue discussed in Monograph 29: “how do sentencing patterns in New South Wales compare with other jurisdictions?”1 As that publication illustrated, the answer is relevant to the public debate on whether sentencing is too harsh or too lenient.2 Indeed either assertion can only be truly tested by reference to other comparable jurisdictions. Full-time imprisonment is used as a comparative indicator because it is a sanction of last resort in common law jurisdictions and therefore a reliable measure of punitiveness.3
This Sentencing Trends & Issues takes advantage of the ongoing release of new sentencing information in Australia and overseas.4 Court outcomes including convictions and the use of full-time imprisonment are updated annually by government agencies.5 National reporting bodies such as the Australian Bureau of Statistics and the Productivity Commission provide annual releases of corrective services data. Research agencies report national and international sentencing information.6
As the Chief Justice of Australia the Honourable Murray Gleeson observed extra-judicially in 2004:
“The more information people are given about what sentencing judges are doing, and why they are doing it, the less likely they are to believe that there is a gulf between their expectations of the criminal justice system and the reality. The more accurate and reliable the information that the public get about what judges do, about the detail of the cases they confront, and about their reasons for decisions, the less likely they are to think that judges do not understand or share their concerns.”7
As part of the public supply of information, Chief Justice Gleeson identified the need for useful sentencing comparisons:
“There is one topic on which the Australian public are given practically no information at all, and that is the way in which sentences in Australia compare with sentences imposed in similar places overseas.”8
The ongoing reporting of sentencing results in New South Wales and other jurisdictions is a step towards filling this void.
Key findings
The latest sentencing data confirms many of the conclusions of the earlier study. The use of full-time imprisonment in Australia remains at historically high levels. Comparing imprisonment rates per 100,000, New South Wales remains higher than the Australian average as well as some overseas jurisdictions. New South Wales continues to report the highest imprisonment rates in Australia for a number of specific offences.
Imprisonment rates per 100,000 adult population
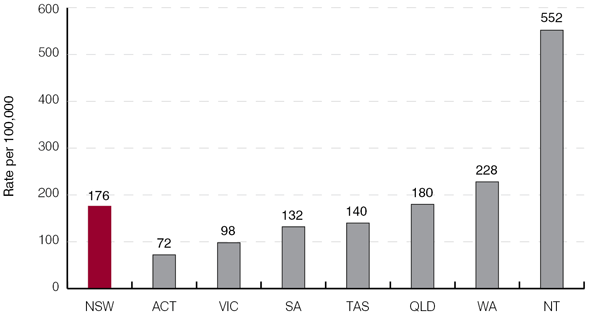
- New South Wales reported the fourth highest adult imprisonment rate in Australia (176) per 100,000 adult population.
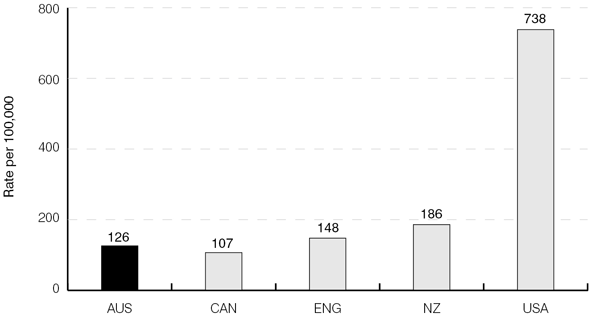
- The New South Wales adult imprisonment rate was higher than the Australian average (160), as well as England (167) and Canada (129).
Imprisonment rates per 100,000 total population
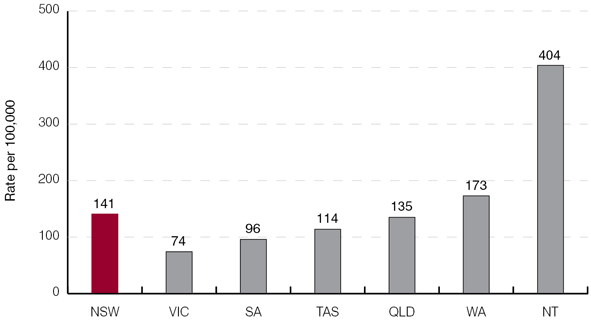
- New South Wales reported the third highest imprisonment rate in Australia per head of total population (141).
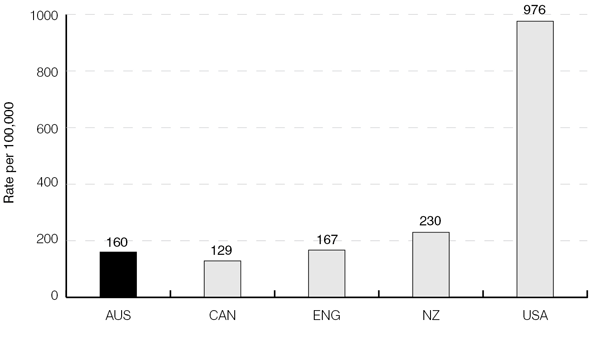
- This was higher than the Australian average (126) and Canada (107), but below England (148).
Full-time imprisonment for specific offences
- New South Wales again reported the highest imprisonment rate in Australia as a proportion of those convicted for sexual assault (93%), robbery (82%) and more serious robbery offences (84%).
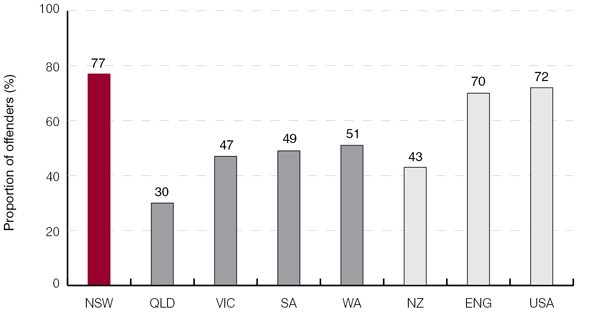
- The imprisonment rate for break and enter/burglary offences (77%) remained higher than all Australian and international jurisdictions.
Corrective services in Australia
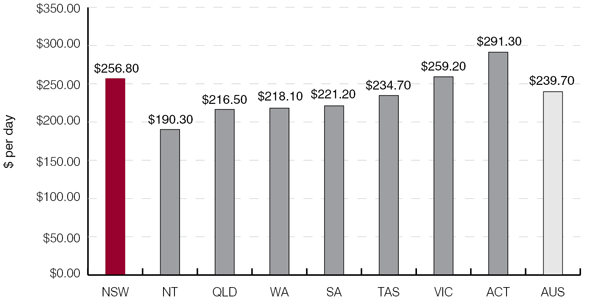
- New South Wales had the third highest cost per prisoner per day ($256.80), after the Australian Capital Territory ($291.30) and Victoria ($259.20).
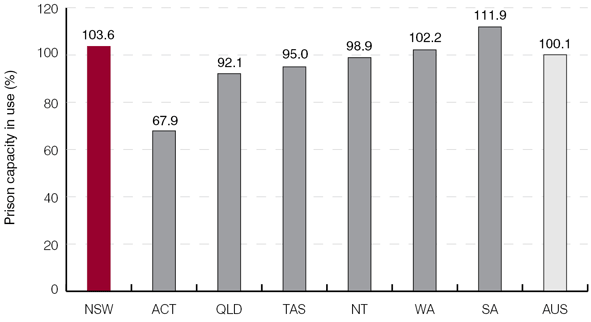
- Prison capacity in use in New South Wales (103.6%) was the second highest after South Australia (111.9%).
Prison population and length of sentences in Australia
- The Indigenous imprisonment rate in Australia was 13 times higher than the non-Indigenous rate. In New South Wales, the Indigenous rate was 12 times higher.
- The Australian imprisonment rate for juveniles has fallen 29% in the last ten years. New South Wales recorded the largest single decrease of 49%.
- Within Australia, 18% of prisoners are serving total sentences of less than 12 months; 57% of prisoners have previously served a sentence of adult imprisonment.
Imprisonment rates per 100,000
As stated in Monograph 29, imprisonment rates per 100,000 provide a broad indicator of punitiveness but should be treated with caution and read alongside other measures.
Using the most reliable and official data available at the time, the earlier report included imprisonment rates per 100,000 based on adult population in Australia and Canada, and total population including juveniles for New Zealand, England and the United States. To provide further specificity on comparative imprisonment rates per 100,000, this study reports separate rates for each jurisdiction for both adult and total population.
This approach was adopted because recent unreported data from the New Zealand Ministry of Justice suggests that restricting results for New Zealand to adult population only would significantly increase the imprisonment rate for that jurisdiction. The rates for England and the United States would also be higher.
Adult population rates
As Figure 1 illustrates, within Australia, New South Wales continues to report the fourth highest imprisonment rate per 100,000 head of adult population (176), after the Northern Territory (552), Western Australia (228) and Queensland (180). The New South Wales rate remains nearly double the Victorian rate (98).
Figure 2 shows that the New South Wales adult imprisonment rate of 176 is higher than the Australian average (160), as well as the adult rates for England (167) and Canada (129).9 The United States (976) and New Zealand (230) were higher.
Figure 1: Australian imprisonment rates per 100,000 adult population, 200610
Figure 2: International imprisonment rates per 100,000 adult population11
Total population rates
Figure 3 presents Australian imprisonment rates per 100,000 head of total population, which includes persons aged less than 18 years old. In 2005, New South Wales (including the Australian Capital Territory) reported the third highest imprisonment rate (141), below the Northern Territory (404) and Western Australia (173), but above Queensland (135).
Compared with national and international imprisonment rates per 100,000 head of total population (Figure 4 below), New South Wales (141) was higher than the Australian average (126) and Canada (107), and below England (148). The United States (738) and New Zealand were also higher (186).
Figure 3: Australian imprisonment rates per 100,000 total population, 200512
Figure 4: International imprisonment rates per 100,000 total population13
Full-time imprisonment for specific offences
Following the method employed in Monograph 29, this study reports new 2005–2006 data on the proportion of offenders receiving full-time imprisonment in four specific offence categories:
- Sexual assault
- Dangerous driving causing death
- Robbery
- Break and enter/burglary
As in the earlier study, results are compared across eight similar common law jurisdictions. The particular statutory offences encompassed in each category are unchanged from the earlier study.14 The sources of the sentencing results — the middle tier of the adult court system in each jurisdiction — are likewise unchanged.15
Most jurisdictions have reported new sentencing data since the earlier comparison. The updated time periods for sentencing results are set out below, by jurisdiction and offence category.
New South Wales
- All offence categories: 3/4/2000–31/12/200616
Victoria
- Sexual assault: 1/7/2001–30/6/2006
- Dangerous driving causing death: 1/7/2001–30/6/2006
- Robbery and more serious robbery: 1/7/2000–30/6/2005
- Break and enter/burglary: 1/7/2000–30/6/2005
Queensland
- All offence categories: 1/7/1999–31/12/2006
South Australia
- Sexual assault: 1/1/2000–31/12/2005
- Dangerous driving causing death: 1/1/2000–31/12/2005
- Robbery and more serious robbery: 1/1/2000–31/12/2005
- Break and enter/burglary: 1/1/2001–31/12/2005
Western Australia
- Sexual assault: 1/1/2004–31/12/2004
- Dangerous driving causing death: 1/1/2004–31/12/2005
- Robbery and more serious robbery: 1/1/2004–31/12/2004
- Break and enter/burglary: 1/1/2004–31/12/2004
New Zealand
- All offence categories: 1/1/2000–31/12/2005
England
- All offence categories: 1/1/2002–31/12/2005
United States
- All offence categories: 1/1/2002–31/12/200217
Sexual assault
New and expanded data in Figure 5 confirms that New South Wales still has the highest proportion of sexual assault offenders sentenced to full-time imprisonment among all Australian jurisdictions.
The overall imprisonment rate in New South Wales (93%) was slightly higher than South Australia (91%). Internationally, it was lower than New Zealand and England (both 96%).
It should be noted that the expanded data for New South Wales includes persons who committed the offence prior to 1 February 2003. From that date, a more punitive standard non-parole period regime applies. See [7-900] in the Commission’s Sentencing Bench Book at www.judcom.nsw.gov.au for further details.
Since the introduction of standard non-parole periods in New South Wales, there has been an upward trend in the use of imprisonment for the three sexual assault offences selected, which shows no sign of abating. Comparing offences committed before and after 1 February 2003 in relation to s 61I offences, the imprisonment rate rises to 91% from 86%. For s 61J offences, the rate rises to 100% from 96%. The imprisonment rate for s 61JA offences remains at 100%. The overall imprisonment rate under the current regime for all sexual assaults is also higher at 95% compared with 92%.18
Figure 5: Proportion of offenders sentenced to full-time imprisonment for sexual assault offences19
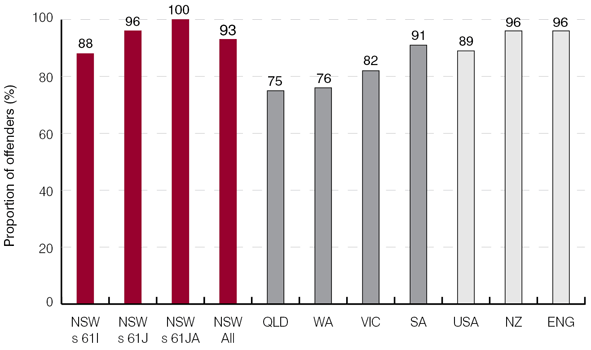
Note:
Section 61I: Sexual assault
Section 61J: Aggravated sexual assault
Section 61JA: Aggravated sexual assault in company
Dangerous driving causing death
Because of varying offence categories in each jurisdiction, it is difficult to report precise comparisons for dangerous driving causing death. As noted in Monograph 29, some jurisdictions do not make a statutory distinction between whether a person is seriously injured or killed. Not all jurisdictions have a separate form of aggravated dangerous driving. In an effort to present the most similar jurisdictions, two separate results are discussed below.
Figure 6 shows results for those jurisdictions which report imprisonment rates for all offences involving dangerous driving causing death. Within Australia, the total imprisonment rate in New South Wales is the same as in South Australia (63%), and higher than Western Australia (38%). Compared internationally, New South Wales is below England (92%).20
Some jurisdictions also report imprisonment rates for more serious forms of dangerous driving causing death, such as offences involving alcohol. In New South Wales, offences committed while under the influence of intoxicating liquor or drugs fall within s 52A(1)(a) Crimes Act 1900. Offences involving a blood alcohol level of 0.15 or more, or other aggravating circumstances, fall within s 52A(2).21
England also reports results for the more serious offence of careless driving causing death under the influence of drink or drugs, under s 3A Road Traffic Act 1988. Victoria reports the more serious offence of culpable driving causing death under s 318 Crimes Act 1958.
Figure 7 illustrates the generally high imprisonment rates across jurisdictions for these more serious driving offences. In New South Wales, where the circumstance of the offence involves alcohol under s 52A(1)(a) or one of the aggravating features under s 52A(2), offenders are almost always imprisoned. For an offence committed under the influence of alcohol or drugs, 84% of offenders were imprisoned. For aggravated offences, the imprisonment rate was 97%.
Figure 6: Proportion of offenders sentenced to full-time imprisonment for dangerous driving causing death22
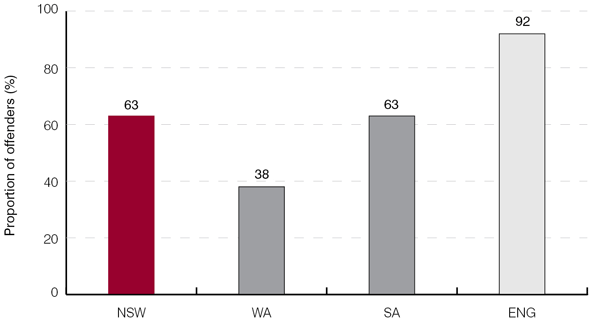
Figure 7: Proportion of offenders sentenced to full-time imprisonment for more serious driving offences causing death23
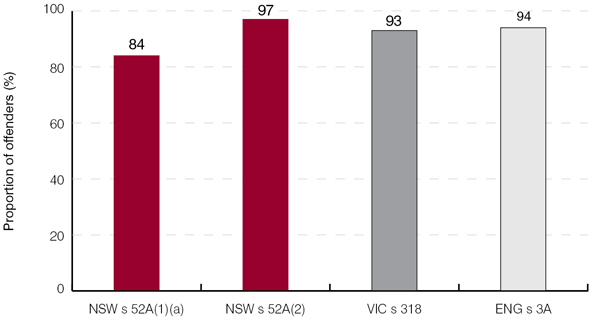
Note:
Section 52A(1)(a): Under the influence of intoxicating liquor or drug
Section 52A(2): Aggravated dangerous driving
Section 318: Culpable driving
Section 3A: Under the influence of drink or drugs
Robbery
As Figure 8 shows, New South Wales continues to report the highest imprisonment rate among Australian jurisdictions for robbery offences (82%).24 Internationally, the New South Wales rate is equal to New Zealand, but slightly below England (85%) and the United States (86%).
Similarly, when more serious forms of robbery are isolated (Figure 9 below), New South Wales again reported the highest imprisonment rate in Australia (84%).
Figure 8: Proportion of offenders sentenced to full-time imprisonment for robbery offences25
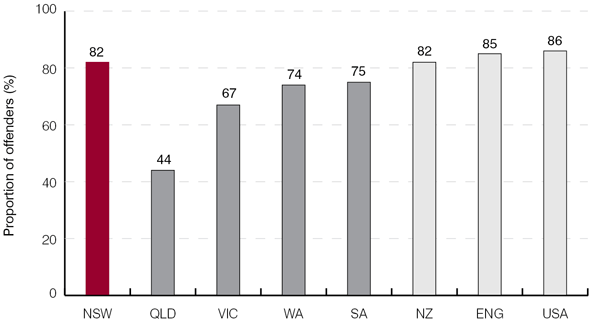
Figure 9: Proportion of offenders sentenced to full-time imprisonment for more serious forms of robbery only26
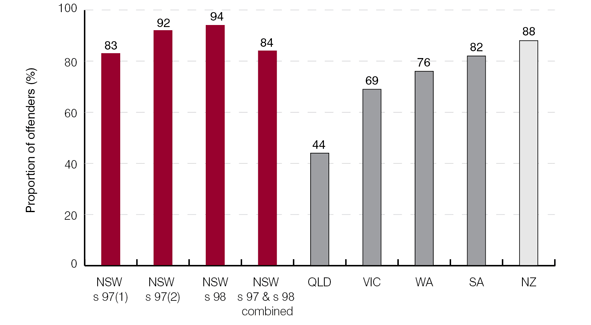
Forms of more serious robbery in NSW:
Section 97(1): Robbery armed or in company
Section 97(2): Robbery armed or in company, with a dangerous weapon
Section 98: Robbery armed or in company, with wounding
Break and enter or burglary
New South Wales retains the highest imprisonment rate for break and enter/burglary offences (77%), across Australian and international jurisdictions (Figure 10 below).27
Figure 10: Proportion of offenders sentenced to full-time imprisonment for break and enter/burglary28
Corrective Services in Australia
Expenditure
The daily cost of incarceration per prisoner is regarded by the Productivity Commission as one indicator of the efficiency of the prison system and its use of resources.29 As Figure 11 illustrates below, in 2005–2006 New South Wales had the third highest cost per prisoner per day ($256.80) after the Australian Capital Territory ($291.30) and Victoria ($259.20).
Figure 11: Expenditure per prisoner per day ($), 2005–200632
Capacity
Another indicator of the management of imprisonment is the use of prison capacity.30 According to the Productivity Commission, optimum use of capacity is between 85% and 95%. In England, appellate courts have repeatedly emphasised that overcrowding is a reason to avoid sending a non-violent offender to prison.31
In Australia, the Productivity Commission has reported that in 2005–2006 the prison system in New South Wales was operating beyond optimal capacity. It had the second highest design capacity in use (103.6%), after South Australia (111.9%). Western Australia (102.2%) had a similarly high rate (Figure 12 below).
Figure 12: Prison capacity in use in Australian states and territories, 2005–200633
Prison population in Australia
Indigenous population
The high rate of Indigenous incarceration is a matter of ongoing public and political concern. The Royal Commission into Aboriginal Deaths in Custody found in 1991 that the imprisonment rate for Indigenous Australians was far higher than the rate for non-Indigenous Australians.34 In 2006, the national imprisonment rate for Indigenous Australians remained 13 times higher. This large discrepancy was reflected in every Australian State and Territory, as Figure 13 and Table 1 illustrate.
Figure 13: Indigenous and non-Indigenous imprisonment rates per 100,000 adult population, 200635
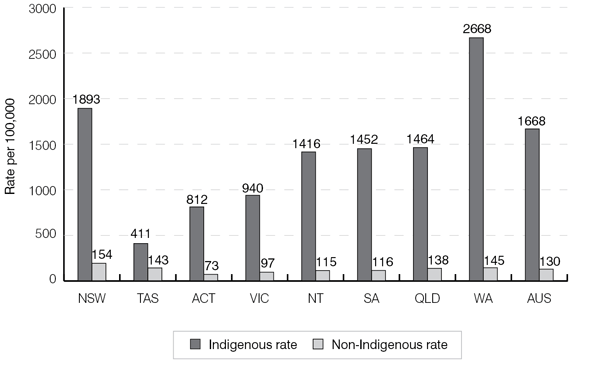
Table 1: Indigenous and non-Indigenous imprisonment rates per 100,000 population
|
NSW
|
VIC
|
QLD
|
SA
|
WA
|
TAS
|
NT
|
ACT
|
AUS
|
|
|---|---|---|---|---|---|---|---|---|---|
| Indigenous |
1893
|
940
|
1464
|
1452
|
2668
|
411
|
1416
|
812
|
1668
|
| Non-Indigenous |
154
|
97
|
138
|
116
|
145
|
143
|
115
|
73
|
130
|
| Over-representation rate |
12 times
|
10 times
|
11 times
|
13 times
|
18 times
|
3 times
|
12 times
|
11 times
|
13 times
|
While Indigenous Australians comprised just 1.6% of the adult population in New South Wales in 2006, they accounted for 19.9% of the State’s prison population.36
Ethnicity
Among all prisoners in New South Wales, 74% were Australian born, with 22% born overseas.37Prisoners born overseas in a non-English speaking country accounted for 17% of the prison population. The proportion of Australian-born prisoners was slightly higher than the proportion of Australian-born residents among the general New South Wales population which, in 2006, was 69%.38
Juveniles in custody
The number of juveniles in custody, and the rate per 100,000 head of population aged 10–17, has generally decreased over the past 10 years.39 This has been an exception to the general trend which saw adult prisoner numbers increase by 42% over a similar period.40
As Table 2 shows, all jurisdictions other than South Australia and Tasmania recorded falls in their imprisonment rates for juvenile offenders between 1995 and 2005. New South Wales had the largest decrease in imprisonment rates for juveniles (-48.6%), greater than the Australian average (-29.0%).
The number and rate of Indigenous juveniles in custody has also declined as part of this overall trend. But the over-representation of Indigenous juveniles in custody compared to non-Indigenous juveniles has in fact increased. In 1995, the imprisonment rate for Indigenous juveniles in Australia was 15 times higher than for non-Indigenous juveniles. In 2005, the rate had become 23 times higher.41
Table 2: Juvenile imprisonment rates per 100,000 head of population aged 10 – 17, 1995 and 200542
|
NSW
|
VIC
|
QLD
|
SA
|
WA
|
TAS
|
NT
|
ACT
|
AUS
|
|
|---|---|---|---|---|---|---|---|---|---|
| 1995 |
57.8
|
14.9
|
35.1
|
49.3
|
24.4
|
17.5
|
74.8
|
37.8
|
38.3
|
| 2005 |
29.7
|
11.8
|
21.7
|
46.5
|
36.4
|
63.5
|
66.8
|
28.4
|
27.2
|
| % Change |
-48.6%
|
-20.8%
|
-38.2%
|
-5.7%
|
+49.2%
|
+262.9%
|
-10.7%
|
-24.9%
|
-29.0%
|
Length of sentence
Short-term custodial sentences have been criticised by governments for failing to promote rehabilitation and contributing to prison overcrowding.43
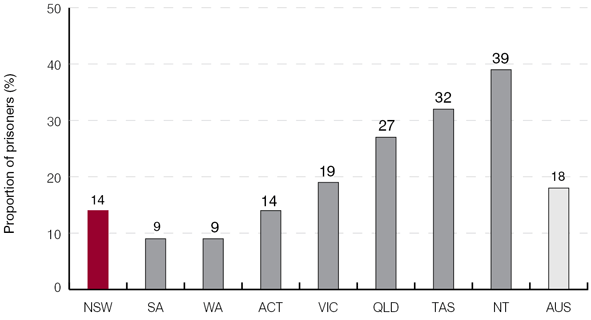
According to the Australian Bureau of Statistics (Figure 14), 18% of Australian prisoners in 2006 were serving aggregate sentences of less than 12 months. However, there was a wide variation between States and Territories, with 9% of prisoners serving short-term sentences in South Australia and Western Australia, compared to 39% in the Northern Territory.44 The proportion in both New South Wales and the Australian Capital Territory was 14%. According to New South Wales Department of Corrective Services statistics, in 2006 more than a quarter of the prison population (27%) were serving a total sentence of less than 2 years.45
Figure 14: Proportion of prisoner population serving aggregate term of sentence less than 1 year, 200646
Prior imprisonment
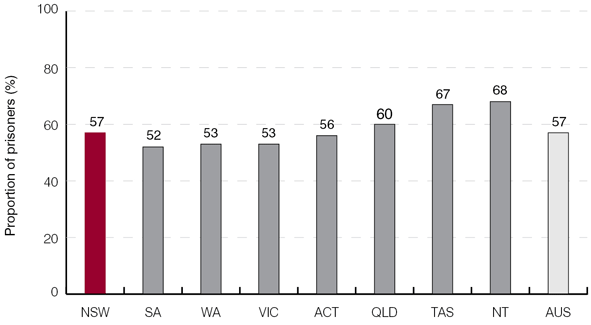
Periods of prior imprisonment have been identified as one factor influencing whether a person is likely to re-offend and be re-imprisoned.47 According to the 2006 National Prisoner Census, 57% of the Australian prison population had previously served a sentence of adult imprisonment.48 AsFigure 15 shows, prior imprisonment rates among prisoners in each jurisdiction varied, from 52% in South Australia to 68% in the Northern Territory.
Within New South Wales, other studies have confirmed the generally high rate of recidivism. In one analysis of offenders released on parole in 2001–2002, 64% had been convicted of a new offence by September 2004, with 41% receiving a custodial sentence.49 Among all parolees in that period, 61% had previously served another period in full-time imprisonment.
Figure 15: Proportion of prisoners with a record of prior adult imprisonment under sentence50
Statistical note on imprisonment rates for specific offences
Sentencing results are based on official court data from each jurisdiction. Only cases dealt with on indictment in the middle tier of the adult court system (the District and High Courts in New Zealand, felonies sentenced in State courts in the United States) are included in the study. Only offenders sentenced for the principal offence in each category are included, with the exception of Western Australia, which records offence counts rather than principal offences.
The full-time imprisonment rate for each offence excludes periodic detention, community and suspended sentences. Victorian legislation allows for partially suspended sentences, as well as combined custody and treatment or community-based orders, but these have been excluded from the full-time imprisonment rates.
Young offenders dealt with in children’s courts are excluded. However, in some serious cases a child will be sentenced “according to law” by the middle tier adult court in each jurisdiction. These offenders are included for all jurisdictions other than Queensland. Some jurisdictions also grant power to middle courts to impose children’s court penalties, which can include a form of full-time imprisonment in a youth detention centre. New South Wales and Queensland alone exclude these offenders from their sentencing results.
For further information on counting techniques used in each jurisdiction, see “Appendix A — The Data” in Monograph 29, available at www.judcom.nsw.gov.au. The tables below record details for specific offences in each jurisdiction, including the legislative reference, date range for results, and numbers of offenders convicted and imprisoned.
Data for New South Wales was obtained from the Commission’s Judicial Information Research System (JIRS). In Victoria, the Sentencing Advisory Council periodically releases Sentencing Snapshots for each offence. Queensland results are from QSIS, the Queensland Sentencing Information Service. In South Australia, the Office of Crime Statistics and Research releases an annual report on Crime and Justice in South Australia. Similarly, the Western Australian Crime Research Centre, a joint project between the State Government and the University of Western Australia, publishes a Crime and Justice Statistics Annual Report. Due to a new sentencing regime and changing statistical definitions, results for Western Australia are more limited than for other jurisdictions.
Internationally, the New Zealand Ministry of Justice publishes Conviction and Sentencing of Offenders in New Zealand each year. Likewise, the United Kingdom Home Office publishesCriminal Statistics, England and Wales annually. In the United States, the U.S. Department of Justice — Bureau of Justice Statistics released Felony Sentences in State Courts, 2002 in 2004.
Table A1: Offenders sentenced to full-time imprisonment for sexual assault offences
| Jurisdiction |
Section
|
Date range
|
No. Convicted
|
No. Imprisoned
|
Percentage
|
|---|---|---|---|---|---|
| NSW |
s 61I
|
3/4/00 – 31/12/06
|
193
|
170
|
88%
|
|
s 61J
|
3/4/00 – 31/12/06
|
275
|
265
|
96%
|
|
|
s 61JA
|
3/4/00 – 31/12/06
|
16
|
16
|
100%
|
|
| VIC |
s 38
|
1/7/01 – 30/6/06
|
181
|
148
|
82%
|
| QLD |
s 349
|
1/7/99 – 31/12/06
|
288
|
217
|
75%
|
| SA |
s 48
|
1/1/00 – 31/12/05
|
66
|
60
|
91%
|
| WA |
ss 325 – 326
|
1/1/04 – 31/12/04
|
383
|
290
|
76%
|
| NZ |
s 128B
|
1/1/00 – 31/12/05
|
1375
|
1319* times
|
96% times
|
| ENG |
s 1
|
1/1/02 – 31/12/05
|
2857
|
2749
|
96%
|
| US |
–
|
1/1/02 – 31/12/02
|
10,980
|
9772
|
89%
|
* New Zealand imprisonment numbers are an approximation, based on reported imprisonment rate and numbers convicted.
Table A2: Offenders sentenced to full-time imprisonment for dangerous driving causing death
| Jurisdiction |
Section
|
Date range
|
No. Convicted
|
No. Imprisoned
|
Percentage
|
|---|---|---|---|---|---|
| NSW |
s 52A(1)(a)
|
3/4/00 – 31/12/06
|
49
|
41
|
84%
|
|
s 52A(1)(b)
|
3/4/00 – 31/12/06
|
2
|
1
|
50%
|
|
|
s 52A(1)(c)
|
3/4/00 – 31/12/06
|
214
|
104
|
49%
|
|
|
s 52A(2)
|
3/4/00 – 31/12/06
|
66
|
64
|
97%
|
|
| VIC |
s 318
|
1/7/01 – 30/6/06
|
134
|
124
|
93%
|
| SA |
s 19A(1)
|
1/1/00 – 31/12/05
|
52
|
33
|
63%
|
| WA |
ss 59(3)(a)(i), 59(3)(b)
|
1/1/04 – 31/12/05
|
16
|
6
|
38%
|
| ENG |
s 1
|
1/1/02 – 31/12/05
|
952
|
875
|
92%
|
|
s 3A
|
1/1/02 – 31/12/05
|
254
|
240
|
94%
|
Table A3: Offenders sentenced to full-time imprisonment for robbery offences
| Jurisdiction |
Section
|
Date range
|
No. Convicted
|
No. Imprisoned
|
Percentage
|
|---|---|---|---|---|---|
| NSW |
ss 94 – 98
|
3/4/00 – 31/12/06
|
3055
|
2516
|
82%
|
| VIC |
ss 75 – 75A
|
1/7/00 – 30/6/05
|
1490
|
1000
|
67%
|
| QLD |
ss 409, 411
|
1/7/99 – 31/12/06
|
1016
|
447
|
44%
|
| SA |
ss 137, 270B
|
1/1/00 – 31/12/05
|
452
|
337
|
75%
|
| WA |
ss 391 – 393
|
1/1/04 – 31/12/04
|
287
|
212
|
74%
|
| NZ |
ss 234 – 236
|
1/1/00 – 31/12/05
|
2572
|
2099*
|
82%
|
| ENG |
s 8
|
1/1/02 – 31/12/05
|
22,052
|
18,812
|
85%
|
| US |
–
|
1/1/02 – 31/12/02
|
38,430
|
33,050
|
86%
|
* New Zealand imprisonment numbers are an approximation, based on reported imprisonment rate and numbers convicted.
Table A4: Offenders sentenced to full-time imprisonment for more serious robbery offences
| Jurisdiction |
Section
|
Date range
|
No. Convicted
|
No. Imprisoned
|
Percentage
|
|---|---|---|---|---|---|
| NSW |
s 97(1)
|
3/4/00 –31/12/06
|
1945
|
1610
|
83%
|
|
s 97(2)
|
3/4/00 – 31/12/06
|
265
|
244
|
92%
|
|
|
s 98
|
3/4/00 – 31/12/06
|
107
|
101
|
94%
|
|
| VIC |
s 75A
|
1/7/00 – 30/6/05
|
1364
|
940
|
69%
|
| QLD |
s 411(2)
|
1/7/99 – 31/12/06
|
886
|
393
|
44%
|
| SA |
ss 5AA(1), 137, 270B
|
1/1/00 – 31/12/05
|
285
|
235
|
82%
|
| WA |
ss 392(c), 393
|
1/1/04 – 31/12/04
|
182
|
138
|
76%
|
| NZ |
s 235
|
1/1/00 – 31/12/05
|
1711
|
1512*
|
88%
|
Table A5: Offenders sentenced to full-time imprisonment for break and enter/burglary
| Jurisdiction |
Section
|
Date range
|
No. Convicted
|
No. Imprisoned
|
Percentage
|
|---|---|---|---|---|---|
| NSW |
ss 112 – 113
|
3/4/00 – 31/12/06
|
2282
|
1748
|
77%
|
| VIC |
ss 76 – 77
|
1/7/00 – 30/6/05
|
781
|
369
|
47%
|
| QLD |
ss 419, 421
|
1/7/99 – 31/12/06
|
2971
|
891
|
30%
|
| SA |
ss 168 – 170
|
1/1/01 – 31/12/05
|
720
|
353
|
49%
|
| WA |
s 401
|
1/1/04 – 31/12/04
|
1246
|
635
|
51%
|
| NZ |
ss 231 – 232
|
1/1/00 – 31/12/05
|
18,063
|
7719*
|
43%
|
| ENG |
ss 9 – 10
|
1/1/02 – 31/12/05
|
42,676
|
29,847
|
70%
|
| US |
–
|
1/1/02 – 31/12/02
|
100,640
|
72,461
|
72%
|
* New Zealand imprisonment numbers are an approximation, based on reported imprisonment rate and numbers convicted.
Endnotes
1 S Indyk and H Donnelly, Monograph 29: Full-time imprisonment in New South Wales and other jurisdictions: a national and international comparison, 2007, Judicial Commission of New South Wales, Sydney, p 1. Available online: www.judcom.nsw.gov.au/category/publications/research-monographs.
2 For example, A Clennell, “Calls for tougher sentences ‘pushing an open door’”, The Sydney Morning Herald, 2/3/2007, p 6.
3 As a sanction of last resort, see s 5(1) Crimes (Sentencing Procedure) Act 1999 (NSW); s 5(4) Sentencing Act 1991 (VIC); s 9(2)(a) Penalties and Sentences Act 1992 (QLD); s 11 Criminal Law (Sentencing) Act 1988 (SA); ss 6(4) and 39(3) Sentencing Act 1995 (WA); s 17A Crimes Act 1914 (Cth); s 8(g) Sentencing Act 2002 (NZ); s 152(2) Criminal Justice Act 2003 (UK); s 718.2(d) Criminal Code 1985 (CAN). Among the jurisdictions included in this study, only the United States has retained the death penalty.
4 The trend towards more readily available comparisons was noted by M Tonry and D Farrington, “Punishment and crime across space and time” (2005) 33 Crime and Justice 1 at 3.
5 In addition to regular updates by the New South Wales Judicial Information Research System, the Queensland Sentencing Information Service and the Victorian Sentencing Advisory Council, see also annual reports from the South Australian Office of Crime Statistics and Research: www.ocsar.sa.gov.au; the Western Australian Crime Research Centre: www.crc.law.uwa.edu.au; the New Zealand Ministry of Justice: www.justice.govt.nz/pubs/reports/index.html; and the United Kingdom Home Office: www.homeoffice.gov.uk/rds/crimstats05.html <accessed 25/9/2007>.
6 Alongside the Judicial Commission’s Monograph 29, the Victorian Sentencing Advisory Council reports national and international sentencing comparisons at: www.sentencingcouncil.vic.gov.au/wps/wcm/connect/Sentencing+Council/Home/Sentencing+Statistics/Adult+Prisoners/ <accessed 29/8/2007>.
7 AM Gleeson, “Out of Touch or Out of Reach?” (2005) 7(3) The Judicial Review 241 at 247.
8 ibid 245. Chief Justice Gleeson subsequently referred to the value of Monograph 29 in K Lumley, “From controversy to credibility: 20 years of the Judicial Commission of New South Wales” (2007) 19(9) Judicial Officers’ Bulletin 73 at 78.
9 In this study, statistics referring to England also include Wales.
10 Australian Bureau of Statistics, Corrective Services, March Quarter 2007, 2007, Canberra, p 11. Data from 2006; includes both remand and sentenced prisoners. Results for the Australian Capital Territory include ACT prisoners held in New South Wales.
11 ibid; New Zealand Ministry of Justice 2005 internal data; K Beattie, “Adult Correctional Services in Canada 2004-2005” (2006) 26(5) Juristat 1 at 8; United Kingdom Home Office, Prison Statistics England and Wales 2002, 2003, London, pp 13, 63; United Kingdom Office for National Statistics, Population Estimates 2002 at: www.statistics.gov.uk/populationestimates/svg_pyramid/default.htm <accessed 27/6/2007>; P Harrison and A Beck,Prison and Jail Inmates at Midyear 2005, 2006, United States Bureau of Justice Statistics Bulletin, Washington DC, pp 1, 5, 8; United States Census Bureau, Annual Estimates of Population, 2007 at: www.census.gov/popest/national/asrh/index.html <accessed 27/6/07>. Australian results for 2006, New Zealand and United States as at 30 June 2005, Canada 2004-2005, England 2002. Results for England and the United States estimated using separate data for prison and overall adult population. Data for all jurisdictions includes remand and sentenced prisoners. “Adult” is defined in most Australian states, England, Canada and the United States as 18 years and over. In Queensland and New Zealand, it is 17 years and over.
12 International Centre for Prison Studies, World Prison Brief at: www.prisonstudies.org <accessed 27/6/2007>. Results at 30 June 2005. Results for New South Wales include the Australian Capital Territory. Further information on the World Prison Brief is available online.
13 R Walmsley, World Prison Population List, Seventh Edition, 2007, International Centre for Prison Studies, London. Results for Australia at 30 June 2005, New Zealand 7 July 2006, Canada 2003–2004, England 27 October 2006, United States 30 June 2005. The latest data for individual jurisdictions is available at www.prisonstudies.org <accessed 23/10/2007>.
14 For a detailed explanation of the offences included in each category by jurisdiction, see Appendix D in S Indyk and H Donnelly, Monograph 29, op cit n 1, pp 43–61.
15 For further details see “Statistical note” below at pp 14–17.
16 The timeframe for New South Wales has also been extended to include an earlier start date of 3 April 2000, the date on which the general sentencing regime under the Crimes (Sentencing Procedure) Act 1999 commenced.
17 In the United States, offence definitions and sentencing outcomes can vary widely between states. This study uses results from the U.S. Department of Justice – Bureau of Justice Statistics, which has released an overall analysis of sentencing results in state courts: M Durose and P Langan, Felony Sentences in State Courts, 2002, 2004, US Department of Justice, Washington DC.
18 For those offenders subject to the previous regime, 107 out of 124 (86%) offenders within s 61I received full-time imprisonment, compared with 63 out of 69 (91%) under the new regime. Similarly for s 61J, 215 out of 225 (96%) offenders received full-time imprisonment under the previous regime, compared with 50 out of 50 (100%) under the current sentencing legislation. Imprisonment rates for s 61JA were 100% under both regimes (9 out of 9 compared with 7 out of 7).
19 For numbers of offenders in each jurisdiction, see “Statistical Note” below at pp 14–17. Results for Victoria include all offences under s 38 Crimes Act 1958; Queensland s 349 Criminal Code 1899; South Australia s 48 Criminal Law Consolidation Act 1935; Western Australia ss 325-326 Criminal Code; New Zealand ss 128B Crimes Act 1961; England s 1 Sexual Offences Act 2003. Results for Western Australia, England and the United States include attempted sexual assaults.
20 Results for Western Australia are a new addition to this study.
21 In s 52A(2), aggravated dangerous driving includes: an offender whose blood alcohol level is 0.15 or more; or the speed of the car exceeds the speed limit by more than 45 km/h; or the offender was escaping a police pursuit; or the offender’s ability to drive was very substantially impaired by drugs.
22 For numbers of offenders in each jurisdiction, see “Statistical Note” below at pp 14–17. Results for New South Wales include offences under ss 52A(1) and 52A(2) Crimes Act 1900; South Australia s 19A(1) Criminal Law Consolidation Act 1935; Western Australia ss 59(3)(a)(i) and 59(3)(b) Road Traffic Act 1974; England ss 1 and 3A Roads Traffic Act1988.
23 For numbers of offenders in each jurisdiction, see “Statistical Note” below at pp 14–17.
24 Results for New South Wales include offenders who committed a robbery under s 98 Crimes Act 1900 prior to the introduction of standard non-parole periods on 1 February 2003, as well as those committed after that date. If offenders not subject to the new legislation are isolated, 61 out of 64 were sentenced to full-time imprisonment (95%). Since the new legislation commenced, 40 out of 43 offenders received full-time imprisonment (93%).
25 For numbers of offenders in each jurisdiction, see “Statistical Note” below at pp 14–17. Results for New South Wales include offences under ss 94, 95, 96, 97(1), 97(2) and 98 Crimes Act 1900; Victoria ss 75 and 75A Crimes Act 1958; Queensland ss 409 and 411 Criminal Code 1899; South Australia ss 137, 270B Criminal Law Consolidation Act 1935; Western Australia ss 391–393 Criminal Code; New Zealand ss 234–236 Crimes Act 1961; England s 8 Theft Act 1968. Results for New South Wales, Queensland and Victoria exclude assault with intent to rob and inchoate offences. Other jurisdictions include these offences.
26 For numbers of offenders in each jurisdiction, see “Statistical Note” below at pp 14–17. Results for Victoria include armed robbery under s 75A Crimes Act 1958; for Queensland, robbery armed, in company or with wounding or personal violence under s 411(2) Criminal Code 1899; for South Australia, armed robbery under ss 5AA(1), 137, 270BCriminal Law Consolidation Act 1935; for Western Australia, armed robbery under ss 392(c), 393 Criminal Code; for New Zealand, robbery armed, in company or causing grievous bodily harm under s 235 Crimes Act 1961. Results for New South Wales, Victoria, Queensland and New Zealand do not include assault with intent to rob offences.
27 Results for New South Wales include offences committed under the aggravated forms of ss 112(2) and 112(3) prior to the introduction of standard non-parole periods on 1 February 2003, as well as offences committed after that date. If offenders not subject to the new legislation are isolated, 297 of 415 offenders (72%) were imprisoned under s 112(2), compared with 301 out of 433 offenders (70%) under the new legislation. For s 112(3), 24 out of 25 (96%) were imprisoned under the previous regime, compared with 17 out of 18 (94%).
28 For numbers of offenders in each jurisdiction, see “Statistical Note” below at pp 14–17. Results for New South Wales include all offences under ss 112 and 113 Crimes Act 1900. For Victoria, offences under ss 76–77 Crimes Act 1958; Queensland
ss 419 and 421 Criminal Code 1899; South Australia ss 168–170 Criminal Law Consolidation Act 1935; Western Australia s 401 Criminal Code; New Zealand ss 231–232 Crimes Act 1961; England ss 9–10 Theft Act 1968. New South Wales, Victoria and Queensland exclude inchoate offences.
29 SCRGSP (Steering Committee for the Review of Government Service Provision), Report on Government Services 2007, 2007, Productivity Commission, Canberra, p 7.21. The Commission cautions that indicators should be read in light of other factors, such as less spending on rehabilitation programs, geographic dispersion within each jurisdiction, and differing population profiles.
30 ibid, p 7.25. The Productivity Commission defines use of prison capacity as the proportion of the annual average daily prisoner population compared with the number of single occupancy cells provided for in the design capacity for prisons in each jurisdiction.
31 R v Seed and Stark [2007] EWCA Crim 254; R v Kefford [2002] EWCA Crim 519; R v Ollerenshaw [1999] 1 Cr App R(S) 65; R v Bibi (1980) 71 Cr App R 360.
32 SCRGSP (Steering Committee for the Review of Government Service Provision), Report on Government Services 2007, op cit n 29, Table 7A.7. Data includes both net recurrent and capital costs for open and secure prison facilities for 2005-2006. Data includes periodic detention facilities but excludes community corrections. The Australian Capital Territory runs two remand facilities and one periodic detention centre, with sentences of imprisonment usually served in NSW gaols.
33 ibid, p 7.25, Table 7A.23. Data includes capacity of both open and secure prison facilities for 2005–2006, and excludes periodic detention centres. Data for Victoria not available. Data for Australian Capital Territory based on remand facilities only.
34 L Snowball and D Weatherburn, “Indigenous over-representation in prison: the role of offender characteristics” (2006) 99 Crime and Justice Bulletin 1; New South Wales Bureau of Crime Statistics and Research and D Weatherburn, L Snowball and B Hunter, “The economic and social factors underpinning Indigenous contact with the justice system” (2006) 104 Crime and Justice Bulletin 1. The latter study found drug and alcohol abuse is the leading cause of Indigenous over-representation in the justice system. The former study found that there was no evidence of racial bias in the decision to imprison.
35 Australian Bureau of Statistics, Prisoners in Australia, 2006, Canberra, pp 5, 14. This comparison uses age-standardised rates from the National Prisoner Census to account for different age distributions among Indigenous and non-Indigenous Australians. The National Prisoner Census includes inmates serving periodic detention on 30 June 2006 in New South Wales and the Australian Capital Territory, and offenders held in community custody centres and work outreach centres in Queensland. Australian Capital Territory prisoners held in New South Wales facilities are included in the Australian Capital Territory data.
36 S Corben, NSW Inmate Census, 2006, NSW Department of Corrective Services, Sydney, p 3; Australian Bureau of Statistics, Prisoners in Australia, Estimated Indigenous Population Data Cube, Estimated Adult Resident Population Data Cube, 2006, Canberra.
37 A remaining 4% of prisoners had an unknown country of origin. See S Corben, NSW Inmate Census, ibid, p 3. Results based on NSW Inmate Census, conducted as part of the National Prisoner Census on 30 June 2006. Results include inmates in full-time custody and those serving periodic detention orders on the census date.
38 Australian Bureau of Statistics, 2006 Census QuickStats: Country of Birth, at www.censusdata.abs.gov.au<accessed 21/8/2007>.
39 N Taylor, Juveniles in Detention in Australia, 1981–2005, 2006, Australian Institute of Criminology, Canberra, p 11.
40 Australian Bureau of Statistics, Press Release: Prisoner numbers increase by 42% in last 10 years, 14/12/2006, Canberra.
41 N Taylor, Juveniles in Detention in Australia, op cit n 39, pp 16, 23. The Australian Institute of Criminology cautions that over-representation ratios may depend on small numbers of Indigenous Australians and juvenile offenders in some jurisdictions, and can fluctuate from year to year.
42 ibid, p 11. The large increase in Tasmania’s imprisonment rate may be partly explained by a particularly low rate in 1995. The Australian Institute of Criminology cautions that juvenile imprisonment numbers are based on census counts at the end of each quarter, leading to higher variability between counts in some jurisdictions, particularly those with smaller populations.
43 United Kingdom Home Office, Making punishments work: Report of a review of the sentencing framework for England and Wales (Halliday Report), 2001, London, p 22; New South Wales Legislative Council, Select Committee on the Increase in Prisoner Population, Inquiry on the Increase in Prisoner Population: Final Report, 2001, New South Wales Parliament, Sydney, p xvii, referred to by Gleeson CJ in Roach v Electoral Commissioner [2007] HCA 43 at [22], in the context of prisoners’ voting rights.
44 Western Australia abolished prison sentences of six months or less in May 2004.
45 S Corben, NSW Inmate Census, op cit n 36, p 3. Unsentenced prisoners on remand awaiting trial or sentencing accounted for a further 22%.
46 Australian Bureau of Statistics, Prisoners in Australia, op cit n 35, pp 35–37. Data excludes periodic detention. Data for the Australian Capital Territory includes prisoners serving sentences in New South Wales prisons.
47 C Jones et al, “Risk of re-offending among parolees” (2006) 91 Crime and Justice Bulletin 1 at 2; T Drabsch,Reducing the Risk of Recidivism, Briefing Paper No 15/06, 2006, NSW Parliamentary Library Research Service, Sydney, p 13.
48 Australian Bureau of Statistics, Prisoners in Australia, op cit n 35, p 32.
49 C Jones et al, “Risk of re-offending among parolees” op cit n 47, at 5.
50 Australian Bureau of Statistics, Prisoners in Australia, op cit n 35, pp 29–32. Prior imprisonment data for Queensland may be under enumerated. Australian Capital Territory data includes prisoners held in New South Wales facilities.


