One of the functions of the Judicial Commission is to “disseminate information and reports on sentences imposed by courts”.1 This Trends reports on the 20 most common offences proven in the Local Court of NSW for the calendar year 2007. It also provides a descriptive analysis of how the various sentencing options available to the court were used to deal with the most common offences. Where appropriate, comparisons are drawn with findings made in previous studies on this topic for the years 2002 and
1992.2 The paper provides a useful summary of contemporary sentencing practices in the Local Court.
Data, definitions and methodology
The following analysis includes all recorded sentences for statutory offences dealt with by the NSW Local Court in the 2007 calendar year. Some breaches of justice orders are excluded from this analysis.3 Regulatory offences have also been excluded from the general analysis; however a brief discussion of their prevalence and sentencing patterns is included at the end.4
Local Court sentencing data is collected by the NSW Bureau of Crime Statistics and Research (BOCSAR) and supplied to the Judicial Commission for use in its studies and the Judicial Information Research System (JIRS).5 The data referred to throughout this study relates to first-instance sentencing
only, and has not been corrected for subsequent successful appeals to higher courts. The analysis is concerned only with “principal offences”. This means that, where an offender has been sentenced for
multiple offences, only the offence which attracted the highest penalty, in terms of the type and quantum of sentence, is included. Where multiple terms of imprisonment were imposed on an offender, either concurrently or cumulatively, the highest individual sentence has been included in the data. All the other lesser terms are excluded.
Some offences (such as driving and property offences) attract higher maximum penalties where an offender is sentenced for a second or subsequent offence, or where the value of the property involved exceeds a certain amount. This analysis does not encompass the presence or absence of criminal antecedents, although property value is considered in some aspects of the final analysis.
Throughout the analysis, the term “median” is used to denote the sentence which lies in the middle of a range of values. This provides a more accurate description of the data than the “mean” (or average)
which may be distorted by unusually large or small values. The “mode” refers to the most frequently occurring value or values.6
Table 1: Most common offences proven statutory offences in the NSW
Local Courts in 2007
|
Rank 2007
|
Rank 2002
|
Offence
|
Legislation
|
Number of cases
|
% of cases
|
|---|---|---|---|---|---|
|
1
|
1
|
Mid-range PCA | Road Transport (Safety and Traffic Management Act 1999, s 9(3) |
10,696
|
9.7
|
|
2
|
2
|
Common assault | Crimes Act 1900, s 61 |
8,195
|
7.5
|
|
3
|
6
|
Low-range PCA | Road Transport (Safety and Traffic Management) Act 1999, s 9(2) |
6,844
|
6.2
|
|
4
|
4
|
Drive whilst disqualified | Road Transport (Driver Licensing) Act 1998, s 25A(1) |
5,563
|
5.1
|
|
5
|
3
|
Larceny | Crimes Act 1900, s 117 |
5,213
|
4.7
|
|
6
|
7
|
Possess prohibited drug | Drug Misuse and Trafficking Act 1985, s 10(1) |
4,919
|
4.5
|
|
7
|
10
|
Drive whilst suspended | Road Transport (Driver Licensing Act 1998, |
4,668
|
4.2
|
|
8
|
8
|
Maliciously destroy/damage property | Crimes Act 1900, s 195(1)(a) |
4,435
|
4.0
|
|
9
|
–
|
Never licensed person drive on road | Road Transport (Driver Licensing) Act 1998, s 25(2) |
4,359
|
4.0
|
|
10
|
11
|
Assault occasioning actual bodily harm | Crimes Act 1900, s 59(1) |
3,982
|
3.6
|
|
11
|
5
|
High-range PCA | Road Transport (Safety and Traffic Management) Act 1999, s 9(4) |
3,888
|
3.5
|
|
12
|
12
|
Drive without being licensed | Road Transport (Driver Licensing) Act 1998, s 25(1) |
3,317
|
3.0
|
|
13
|
9
|
Knowingly contravene AVO | Crimes Act 1900, s 562ZG(1) |
3,065
|
2.8
|
|
14
|
19
|
Offensive conduct | Summary Offences Act 1988, s 4 |
2,456
|
2.2
|
|
15
|
16
|
Assault with intent on certain officers | Crimes Act 1900, s 58 |
2,242
|
2.0
|
|
16
|
14
|
Drive unregistered vehicle | Road Transport (Vehicle Registration) Act 1997, s 18(1) |
2,049
|
1.9
|
|
17
|
13
|
Negligent driving (not causing death or GBH) | Road Transport (Safety and Traffic Management) Act 1999, s 42(1)(c) |
2,036
|
1.9
|
|
18
|
18
|
Offensive language | Summary Offences Act |
1,574
|
1.4
|
|
19
|
17
|
Goods in custody | Crimes Act 1900, s 527G(1) |
1,379
|
1.3
|
|
20
|
–
|
Drive recklessly/furiously or dangerous speed/manner | Road Transport (Safety and Traffic Management) Act 1999, s 42(2) |
1,215
|
1.1
|
| Total for top 20 offences |
82,095
|
74.7
|
|||
| All remaining offences |
27,837
|
25.3
|
|||
| Total |
109,932
|
100.0
|
General findings
Volume of offenders
The 20 most common proven offences in 2007 appear in Table 1 (“the list”). These offences accounted for 82,095 offenders, or 74.7% of the total number sentenced in that year. The total volume of offenders sentenced in the Local Court for 2007 was 109,932 (excluding regulatory offences). While there has been an increase in the volume of offenders since 2002, the figures for 2007 cannot be directly compared with the figures for 2002. The exclusion of some breaches of justice orders in 2007 has had the effect of understating the total number of offenders sentenced compared with 2002. This may have also affected the selection of the principal offence in cases where there was at least one offence, other than the breach.7 Nevertheless, according to figures published by BOCSAR, the total volume of offenders has increased by approximately 10% since 2002.8
Distribution of the most common offences
The distribution of the 20 most common proven offences in 2007 closely resembles the distribution for 2002. There are only two new offences which appear in the list for 2007, and many of the offences appearing in the 2007 list hold similar positions as they held in 2002.
The two offences appearing in the 2002 list which do not appear in the 2007 list are (with their 2002 rankings shown in parentheses):
- (15) “Drive whilst licence refused or cancelled”: Road Transport (Driver Licensing) Act1998, s 25A(3) and
- (20) “Break, enter and steal”: Crimes Act 1900, s 112(1).
The two new offences to appear in the 2007 list are (with their 2007 rankings shown in parentheses):
- (9) “Never licensed person drive on road”: Road Transport (Driver Licensing) Act 1998, s 25(2) and
- (20) “Drive recklessly/furiously or at a speed or in a manner dangerous to the public”: Road Transport (Safety and Traffic Management) Act 1999, s 42(2).
A further two offences from the list, “maliciously destroy/damage property”9 and “knowingly contravene an apprehended violence order (AVO)”,10 have been subject to legislative restructuring; however the substantive offences have not changed for the purposes of this study.
Particular offences
Prescribed concentration of alcohol (PCA) offences
PCA offences in the low, middle and high-range categories are all amongst the 20 most common offences for 2007. These three offences accounted for 21,428 offenders or 19.5% of the total. Whilst the frequency of PCA offences has remained remarkably stable since previous studies (21,183 in 2002 and 21,848 in 1992), the proportion of offenders falling into this category has continued to decrease, down from 20.6% in 2002 and 24.4% in 1992.
Mid-range PCA was the most common offence in 2007, as it was in 2002 and 1992. However, the frequency and overall proportion of offenders has continued to decrease. In 2007 there were 10,696 offenders sentenced for this offence, compared with 11,501 in 2002 and a similar number in 1992. Mid-range PCA offenders represented a lesser proportion of overall offenders in 2007 when compared with 2002, namely 9.7% compared with 11.2%. This is consistent with an overall pattern of reduction in the prevalence of PCA offences in the mid-range and high-range categories.
Low-range PCA offences and high-range PCA offences also remain in the list for 2007, despite changes in their rankings. The proportion of offenders sentenced for high-range PCA offences in 2007 was 3.5% (or 3888 offenders), compared with 4.7% in 2002 (or 4864 offenders). It has fallen from the fifth most common offence to the 11th. The number of offenders sentenced for low-range PCA offences, on the other hand, has increased, resulting in a jump from the sixth most common offence to the third. This offence now represents 6.2% (or 6844 offenders) of the total number of offenders, up from 4.7% (or 4818 offenders) in 2002.
Driving, licensing and vehicle registration offences
Seven of the 20 most common offences relate to driving, licensing and vehicle registration (excluding PCA offences). All but two of these offences appeared in the list for 2002. The two new offences to appear are “never licensed person drive on road”, and “drive recklessly/furiously or at a speed or in a manner dangerous”. One offence to appear in 2002 (“drive whilst licence refused or cancelled”)11 no longer appears in the top 20, but is now ranked 44, accounting for only 326 offenders. However, the remaining five offences hold similar rankings to those in previous studies, with two offences (“drive whilst disqualified” and “drive without being licensed”) holding the same positions as in the 2002 list.
The seven offences in this category accounted for 23,207 offenders or 21.1% of the total. The most common offence was “drive whilst disqualified”, which accounted for 5563 offenders or 5.1% of the total. When combined with offenders sentenced for the three PCA offences in the list, a total of 44,635 offenders were sentenced for 10 offences relating to the use and operation of a motor vehicle, accounting for 40.6% of all offenders sentenced in the Local Court in 2007.
Offences against the person
Three of the 20 most common offences in 2007 were offences against the person. These accounted for 14,419 offenders or 13.1% of the total. “Common assault” remained the second most common offence, as it did in 2002 and 1992, accounting for 8195 offenders or 7.5% of the total. “Assault occasioning actual bodily harm” and “assault with intent to commit a serious indictable offence on certain officers” under ss 59(1) and 58 of the Crimes Act 1900 respectively, also hold rankings similar to those held in 2002, each having moved one position up the list. While the frequency of each offence has increased, the proportions relative to the overall number of offenders sentenced in the Local Court in 2007 are not appreciably different to the respective proportions in 2002.
Property offences
Three of the 20 most common offences in 2007 were property offences. These accounted for 11,027 offenders or 10.0% of the total. The most common of these offences was “larceny”, accounting for 5213 offenders or 4.7% of the total. “Larceny” was the fifth most common offence for 2007, falling from third position in 2002, when it accounted for 6.6% of the total. “Maliciously destroy/damage property” was the eighth most common offence, as it was in 2002 and 1992. The offence of “goods in custody” has fallen to 19th position, representing 1.3% of the total number of offenders, compared with 2.0% in 2002. “Break, enter and steal”,12 which was ranked 20th most common offence in 2002, no longer appears in the list. It is now ranked 24th and accounted for 999 offenders in 2007.
Drug offences
The offence of “possess prohibited drug” is the only drug-related offence in the list. It accounted for 4919 offenders or 4.5% of the total. It holds the rank of sixth most common offence, up one position since 2002. At that time it represented 4.0% of the total number of offenders, and was also the only drug-related offence in the list.
Other offences
Two of the remaining three offences in the list are public order offences. These are “offensive conduct”, accounting for 2456 offenders or 2.2% of the total, and “offensive language”, accounting for 1574 offenders or 1.4% of the total. “Offensive conduct” has moved five positions up the list since 2002, making it the 14th most common offence. “Offensive language” has not moved from its ranking as the 18th most common offence.
The only other offence to appear in the list is “knowingly contravene apprehended violence order (AVO)”. It was the 13th most common offence in 2007, compared with the ninth most common in 2002. It accounted for 3065 offenders or 2.8% of the total. As a proportion of the total number of offenders, there has been no significant change since 2002.
Penalties and sentences
The Crimes (Sentencing Procedure) Act 1999 (“the Act”) divides sentencing options into custodial sentences and non-custodial alternatives. Custodial sentences include full-time imprisonment (ss 5, 44–46), periodic detention (s 6) and home detention (s 7).13 Non-custodial alternatives include community service orders (“CSOs”) (s 8), good behaviour bonds (s 9), dismissals of charges and conditional discharges (s 10), convictions with no other penalty (s 10A) and suspended sentences (s 12). The term “imprisonment” may be used generically to refer to any of the custodial sentencing options or to a term of suspended sentence.
Penalties imposed in accordance with the Crimes Act 1914 (Cth) may differ in terminology to penalties under the NSW legislation; however, for the purposes of this study Commonwealth offences have been included in the figures for the relevant State provisions.14 Figure 1 displays the distribution of penalty types for all 109,932 offenders sentenced in the Local Court in 2007. The following is a summary of the relevant statistics for each penalty type, from most frequently ordered to least.
Figure 1: Distribution of penalty types for offenders sentenced in
the NSW Local Court in 2007
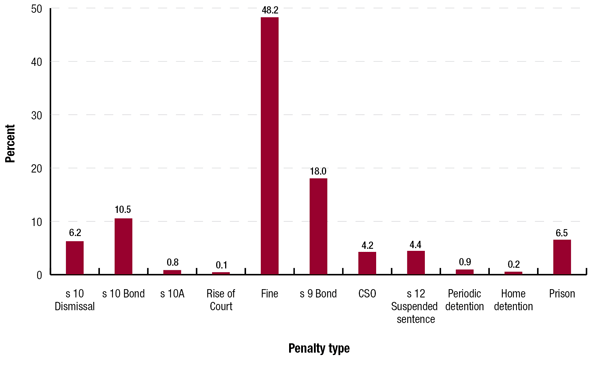
Fines accounted for almost half of all sentences (48.2%).15 The median fine amount was $400, unchanged since 2002. The mode was $500 (imposed on 15.2% of offenders) and the majority of fines (57.5%) were in the range of $200 to $500. The proportion of penalties represented by fines in 2007 is slightly less than in 2002 (50.2%); however, fines still represent the most common penalty in the Local Court by a very substantial margin.
Good behaviour bonds under s 9 of the Act accounted for 18.0% of all sentences.16 In 2002, s9 bonds only accounted for 14.5% of penalties, indicating a noticeable increase in their use. The median length of bonds overall and for NSW offences specifically was 12 months, accounting for almost half of the bonds
imposed (49.7%). The median length of bonds for Commonwealth offences was 24 months. Of the total number of bonds, 66.5% were unsupervised, whilst supervised bonds had a slightly higher median length (15 months).
Dismissals and discharges without conviction under s 10 of the Act accounted for 16.7% of all sentences.17 Of this figure, 6.2% of offences were dismissed unconditionally, and 10.5% of offenders were conditionally discharged on a good behaviour bond. In those cases in which a bond was imposed, the median term was 12 months, which was also the mode (54.0%).
Terms of full-time imprisonment were imposed on 6.5% of offenders.18 The median sentence was eight months compared with six months in 2002. Where a non-parole period was imposed, the median length of head sentences was 12 months, and the median length of non-parole periods was six months. This suggests that magistrates are frequently finding special circumstances for the purpose of varying the statutory ratio established by s 44(2) of the Act.19 In fact, special circumstances were found in almost two-thirds of the cases where a non-parole period was set (66.4%). The most common ratios (between the non-parole period and the full term of sentence) were 2:3 and 1:2 (imposed on 15.6% and 14.4% of offenders respectively). Fixed terms of imprisonment were imposed in just over half of the cases (50.3%). Of those cases involving fixed terms, 7.5% involved terms in excess of six months.20
Suspended sentences under s 12 of the Act were imposed on 4.4% of offenders.21 The median term was nine months, and the mode was 12 months (26.5%). The median term of suspended sentences was
longer for Commonwealth offences (24 months) compared with NSW offences (nine months). This may be partially explained by the availability of terms longer than 24 months for Commonwealth offences, whereas terms imposed for NSW offences cannot exceed two years. Supervision was imposed in 53.6% of cases. There was no significant difference in length of terms between supervised and unsupervised suspended sentences.
Community service orders (CSOs) accounted for 4.2% of sentences.22 The median length of CSOs was 100 hours. This was also the mode, accounting for 29.6% of CSOs. These figures were
relatively consistent across all areas of offending.
Periodic detention was imposed on 0.9% of offenders.23 The median term was eight months compared with six months in 2002, whilst the mode was six months (23.4%). A further 21.7% of offenders received terms of 12 months.
Conviction recorded with no other penalty was imposed under s 10A of the Act in only 0.8% of cases. This is a relatively new sentencing option. It has been available from 29 November 2006.
Home detention was imposed on only 0.2% of offenders. The median term imposed was nine months compared with six months in 2002, and the mode was 12 months (22.5%). A further 21.2% of offenders received terms of six months and 18.2% of offenders received terms of nine months.
Rise of court (sentenced to the rise of the court) was imposed on only 0.1% of offenders compared with 0.5% in 2002. This penalty is similar in nature to the new s 10A.
Penalties for the 20 most common offences
As mentioned above, some offences (particularly driving offences) attract different maximum
penalties depending on the offender’s prior record. The following penalty information does not discriminate between these offenders; however it is likely that offenders who have prior records for similar offences receive harsher penalties than offenders without any prior record.24 A prior driving record is relevant to the issue of personal and general deterrence.25
The following is a brief description of the sentencing patterns for the 20 most common offences. See Table 2 for a detailed distribution of the penalties imposed for each offence.
Table 2: Distribution of penalty types for the most common proven
statutory offences in the NSW Local Court in 2007
|
Penalty type (%)
|
||||||||||||
|---|---|---|---|---|---|---|---|---|---|---|---|---|
|
Rank
|
Offence description
|
s 10 Dism
|
s 10 Bond
|
s 10A
|
ROC
|
Fine
|
s 9 Bond
|
CSO
|
s 12 Susp
|
PD
|
HD
|
Prison
|
|
1
|
Mid-range PCA |
1.5
|
15.9
|
0.2
|
0.0
|
63.7
|
12.8
|
3.1
|
1.3
|
0.5
|
0.2
|
0.9
|
|
2
|
Common assault |
4.7
|
17.5
|
0.6
|
0.1
|
19.7
|
40.8
|
3.4
|
5.4
|
0.7
|
0.0
|
7.2
|
|
3
|
Low-range PCA |
6.8
|
32.5
|
0.5
|
0.0
|
58.9
|
1.3
|
0.1
|
No term of imprisonment available
|
|||
|
4
|
Drive whilst disqualified |
0.7
|
3.5
|
0.2
|
0.0†
|
20.1
|
19.7
|
18.4
|
15.0
|
4.6
|
1.5
|
16.3
|
|
5
|
Larceny |
7.2
|
12.1
|
0.8
|
0.2
|
39.8
|
20.2
|
2.2
|
4.8
|
0.6
|
0.1
|
11.9
|
|
6
|
Possess prohibited drug |
5.5
|
9.8
|
1.6
|
0.3
|
66.8
|
11.6
|
0.5
|
1.2
|
0.1
|
0.0†
|
2.5
|
|
7
|
Drive whilst suspended |
8.9
|
19.5
|
0.4
|
0.0
|
58.1
|
9.9
|
1.9
|
0.9
|
0.1
|
0.0†
|
0.3
|
|
8
|
Maliciously destroy/damage property |
7.1
|
13.6
|
1.1
|
0.4
|
39.6
|
27.5
|
2.9
|
2.5
|
0.4
|
0.0
|
4.9
|
|
9
|
Never licensed person drive on road |
7.2
|
5.5
|
0.8
|
0.0
|
77.3
|
6.8
|
1.2
|
0.7
|
0.2
|
0.0†
|
0.3
|
|
10
|
Assault occassioning actual bodily harm |
1.2
|
8.3
|
0.2
|
0.1
|
11.2
|
44.6
|
7.5
|
10.4
|
2.1
|
0.0
|
14.5
|
|
11
|
High-range PCA |
0.1
|
2.6
|
0.1
|
0.0†
|
40.4
|
28.0
|
11.6
|
9.1
|
2.1
|
0.8
|
5.2
|
|
12
|
Drive without being licensed |
10.9
|
3.3
|
1.3
|
0.0
|
81.2
|
2.7
|
0.2
|
No term of imprisonment available
|
|||
|
13
|
Knowingly contravene AVO |
4.5
|
6.3
|
1.8
|
0.8
|
20.6
|
33.5
|
4.3
|
10.3
|
1.4
|
0.0†
|
16.4
|
|
14
|
Offensive conduct |
17.8
|
8.1
|
1.5
|
0.0†
|
65.8
|
5.7
|
0.5
|
0.0
|
0.0
|
0.0
|
0.9
|
|
15
|
Assault with intent on certain officers |
2.3
|
7.9
|
0.2
|
0.2
|
30.8
|
35.4
|
5.9
|
6.6
|
0.8
|
0.1
|
9.7
|
|
16
|
Drive unregistered vehicle |
18.6
|
0.5
|
2.4
|
0.0
|
78.2
|
0.1
|
0.0
|
No term of imprisonment available
|
|||
|
17
|
Negligent driving (not causing death or GBH) |
16.4
|
2.8
|
1.0
|
0.0
|
78.9
|
0.7
|
0.0†
|
No term of imprisonment available
|
|||
|
18
|
Offensive language |
11.0
|
5.6
|
1.6
|
0.1
|
81.1
|
0.4
|
0.2
|
No term of imprisonment available
|
|||
|
19
|
Goods in custody |
2.4
|
6.4
|
0.7
|
0.3
|
38.9
|
23.7
|
3.2
|
5.7
|
0.6
|
0.1
|
18.0
|
|
20
|
Drive recklessly/furiously or dangerous speed/manner |
0.3
|
3.0
|
0.2
|
0.0
|
47.9
|
21.2
|
10.3
|
5.2
|
2.1
|
0.4
|
9.5
|
| All remaining offences |
7.4
|
6.4
|
1.0
|
0.2
|
46.5
|
17.0
|
4.8
|
5.6
|
1.0
|
0.3
|
9.8
|
|
| Total |
6.2
|
10.5
|
0.8
|
0.1
|
48.2
|
18.0
|
4.2
|
4.4
|
0.9
|
0.2
|
6.5
|
|
| Total number of cases |
6765
|
11580
|
882
|
148
|
52965
|
19752
|
4593
|
4864
|
958
|
231
|
7194
|
|
† The number of cases recorded was <0.1%
1. Mid-range PCA
Road Transport (Safety and Traffic Management) Act 1999, s 9(3). Maximum penalty: 20 pu26 or imprisonment for 9 months or both (first offence) [automatic licence disqualification 12 months, minimum 6 months]; 30 pu or imprisonment for 12 months or both (second or subsequent offence) [automatic licence disqualification 3 years, minimum 12 months].
The majority of offenders sentenced for this offence received a fine (63.7%). The median fine amount was $700, and the mode was $800 (13.4%). Fines of $500 (13.0%) and $600 (11.6%) were also
common. The vast majority of fines (80.9%) were in the range of $400 to $1000.
The second most common penalty for this offence was a conditional discharge (bond) under s 10 (15.9%). Only 1.5% of offences were unconditionally dismissed. Good behaviour bonds under s 9
were imposed in 12.8% of cases, CSOs in 3.1% and full-time imprisonment in only 0.9%. The median length of full-time prison terms was six months, with a mode of nine months (20.4%).
The severity of penalties for this offence has increased since 2002. The proportion of s 10 orders dropped sharply by 9.2 percentage points (from 26.6% in 2002 to 17.4% in 2007), indicating that magistrates were less likely to dismiss charges without recording a conviction and thereby avoid the statutory consequences of a conviction. The reduction in the use of s 10 orders was accompanied by
an increase in the use of s 9 bonds (up 6.1 percentage points). Small increases in the use of other more severe dispositions were also observed. While the proportion of fines has remained about the same, the
fine amounts for 2007 were, on average, slightly higher (up from $600 in 2002).
Licence disqualification: 82.6% of offenders were disqualified from holding a driver’s licence. This is an increase of 9.3 percentage points from 2002 figures. The median term of disqualification was eight months (up from seven months in 2002), and the mode was six months (44.9%). A further 23.0% of
offenders were disqualified for 12 months.
2. Common assault
Crimes Act 1900, s 61. Maximum penalty in Local Court: 20 pu or imprisonment for 12 months or both.
The vast majority of offenders received non-custodial sentences (92.1%). The most common penalty was a good behaviour bond under s 9 (40.8%, the second highest rate in the list), followed by a fine (19.7%) and a conditional discharge (bond) under s 10 (17.5%). A further 4.7% of offences were
unconditionally dismissed. Full-time imprisonment was imposed in 7.2% of cases. There was an increase of 8.3 percentage points in the proportion of offenders receiving s 9 bonds since 2002, with a correlative decrease of 8.9 percentage points in the proportion of fines issued.
The median fine amount was $500 (up from $400 in 2002), which was also the mode (22.0%). Just over half the fines (52.9%) were in the range of $300 to $500, whereas the vast majority of fines (86.0%) were in the range of $200 to $800. The median term of full-time imprisonment was six months (up from four months in 2002), which was also the mode (15.1%). Terms of 12 months’ duration (14.2%), nine months
(13.4%) and three months (12.2%) were also common. As was the case in 2002, both the rate of full-time imprisonment and the median length of terms for this offence were approximately half of those for the offence of “assault occasioning actual bodily harm” (see below at item 10 in the list).
3. Low-range PCA
Road Transport (Safety and Traffic Management) Act 1999, s 9(2). Maximum penalty: 10 pu (first offence) [automatic licence disqualification 6 months, minimum 3 months]; 20 pu (second or subsequent
offence) [automatic licence disqualification 12 months, minimum 6 months].
The majority of offenders received a fine for this offence (58.9%). This is an increase of 4.8 percentage points since 2002. The median fine amount was $477.50 (up from $400 in 2002), and the mode was $500 (19.0%). Almost three-quarters of fines (71.0%) were in the range of $300 to $600.
This offence attracted the highest rate of s 10 conditional discharges (bond) in the list (32.5%). A further 6.8% of offences were unconditionally dismissed, a noticeable reduction since 2002 of 6.6 percentage points.
Good behaviour bonds under s 9 were ordered in 1.3% of cases, and convictions with no other penalty under s 10A were recorded in 0.5% of cases. Only 0.1% of offenders received CSOs. This offence does not attract terms of imprisonment.
Licence disqualification: 60.4% of offenders were disqualified from holding a driver’s licence. This is an increase of 4.8 percentage points from 2002 figures. The median period of disqualification was four months (up from three months in 2002). The mode was three months, accounting for 49.3% of disqualifications. A further 26.7% of offenders were disqualified for six months.
4. Drive whilst disqualified
Road Transport (Driver Licensing) Act 1998, s 25A(1). Maximum penalty: 30 pu or imprisonment for 18 months or both (first offence) [mandatory minimum licence disqualification 12 months]; 50 pu or imprisonment for 2 years or both (second or subsequent offence) [mandatory minimum licence disqualification 2 years].
The sentencing pattern for this offence reveals an unusually high rate of custodial sentences relative to the other driving offences in the list (22.3% compared with 8.1% for high-range PCA, representing the second highest rate of custodial sentences). Nevertheless, the rate of custodial sentences was 4.7 percentage points lower than the rate observed in 2002.
As was the case in 2002, this offence attracted one of the lowest rates of fine-only outcomes, and one of the highest rates of full-time imprisonment. The most common penalty was a fine (20.1%) followed closely by a s 9 good behaviour bond (19.7%). Full-time imprisonment was imposed on 16.3% of offenders, the third highest rate of any offence in the list. This offence also attracted the highest rates of CSOs (18.4%), suspended sentences (15.0%), periodic detention (4.6%) and home detention (1.5%).
The median fine amount was $700 (down from $800 in 2002), whilst the mode was $1000 (18.1%). The median length of full-time prison terms was nine months (up from six months in 2002), with a mode of 12 months (24.6%).
Licence disqualification: 95.7% of offenders were disqualified from holding a driver’s licence. The median period of disqualification was two years, accounting for 79.8% of disqualification periods. A further 12.6% of offenders were disqualified for 12 months.
5. Larceny
Crimes Act 1900, s 117. Maximum penalty in Local Court: 20 pu or imprisonment for 12 months or both (property value does not exceed $2000); 50 pu or imprisonment for 12 months or both (property value does not exceed $5000); 100 pu or imprisonment for 2 years or both (property value exceeds $5000).
The most common sentence imposed for this offence was a fine (39.8%). This represents a decrease of 3.3 percentage points from 2002 figures. The median fine amount was $300, which was also the mode (18.2%). Almost three-quarters of fines (73.3%) were in the range of $200 to $500.
The next most common sentence was a s 9 good behaviour bond (20.2%, an increase of 4.1 percentage points since 2002), followed by a conditional discharge (bond) under s 10 (12.1%). A further 7.2% of offences were unconditionally dismissed. Larceny attracted the fifth highest rate of full-time imprisonment in the list (11.9%). The median term of full-time imprisonment was six months (up from four months in 2002), which was also the mode (22.7%).
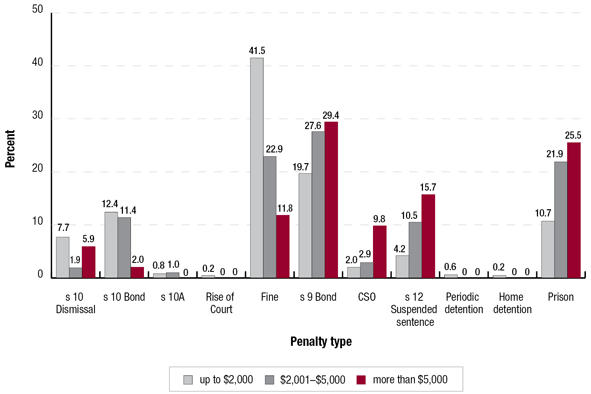
Sentencing patterns indicate that more serious penalties were imposed where the property stolen was of greater value. Most offences (96.3%) involved property worth up to $2000,27 with sentences for this group closely resembling the overall patterns for larceny. Offences in the upper band (property worth more than $5000) accounted for only 1.2% of cases. These offenders received more serious penalties on average, with 25.5% sentenced to full-time imprisonment and only 11.8% receiving fines. They also
received higher rates of suspended sentences (15.7%), CSOs (9.8%) and s 9 good behaviour bonds (29.4%). Figure 2 displays the distribution of penalty types for larceny offences according to the value of property stolen.
Outcomes within sentence types were also more severe where property involved was of greater value. Offences in the upper band attracted a median fine of $850 and a median term of full-time imprisonment of 12 months, whereas offences in the lower band attracted a median fine of $300 and a median full-time prison term of six months. Offences in the middle band (property worth more than $2000 but not more than $5000) attracted a median fine of $500 and median term of full-time imprisonment of 12 months.
Figure 2: Distribution of penalty types for larceny offenders sentenced in the NSW Local Court in 2007 according to the value of property stolen
6. Possess prohibited drug
Drug Misuse and Trafficking Act 1985, s 10(1). Maximum penalty: 20 pu or imprisonment for 2 years or both.
Two-thirds of offenders received a fine (66.8%), with a median value of $300 and a mode of $200 (18.0%). The vast majority of fines (85.6%) were in the range of $100 to $500. The second most common sentence was a s 9 good behaviour bond (11.6%), followed by a conditional discharge (bond) under s 10 (9.8%). A small number of offences were unconditionally dismissed (5.5%) whilst only 2.5% of offenders were sentenced to full-time imprisonment. The median term of full-time imprisonment was two months, with terms of one month accounting for 40.5% of full-time prison sentences.
Generally, these penalties were similar to those recorded in 2002. Fines for 2007 were, on average, slightly higher (up from $250).
The majority of offenders were sentenced for possession of cannabis (60.2%), followed by amphetamines (20.3%), ecstasy (11.5%), heroin (4.9%), and cocaine (2.3%). The remaining 0.8% of possession offences involved other types of drugs.28 Possession of cannabis was more likely to attract a fine (73.2%), compared with amphetamines (62.9%), heroin (59.9%), cocaine (49.1%) and ecstasy (47.9%). Possession of heroin, and to a lesser extent amphetamines, were more likely to attract a full-time prison sentence than other drugs (5.4% and 3.8% respectively), whereas possession of amphetamines was likely to attract more severe outcomes within penalty types. Possession of amphetamines attracted a median fine of $400 and a median full-time prison term of three months, compared with a median fine of $250 for cannabis, $300 for heroin and ecstasy, and $350 for cocaine, and a median full-time prison term of one month for cannabis and heroin.
7. Drive whilst suspended
Road Transport (Driver Licensing) Act 1998, s 25A(2). Maximum penalty: 30 pu or imprisonment for 18 months or both (first offence) [mandatory minimum licence disqualification 12 months]; 50 pu or imprisonment for 2 years or both (second or subsequent offence) [mandatory minimum licence disqualification 2 years].
Sentencing patterns for this offence reveal a greater degree of leniency than for the similar offence of “drive whilst disqualified” (which carries an identical maximum penalty: see item 4 in the list). Non-custodial sentences accounted for 99.5% of offenders. The majority of offenders received a fine (58.1%). Conditional discharges (bond) under s 10 accounted for 19.5% of sentences, whilst a further 8.9% of offences were unconditionally dismissed and 1.9% of offenders received CSOs. Only 0.9% of offenders were sentenced to a suspended sentence and 0.3% to full-time imprisonment.
There was a noticeable increase in the use of s 10 non-conviction orders since 2002 (5.0 percentage points from 23.4% to 28.4%), while fines fell by 5.7 percentage points.
Outcomes within sentence types also tended to be more lenient than for “drive whilst disqualified”. The median fine amount was $500, which was also the mode (21.4%). Almost half the fines (49.3%) were in the range of $400 to $600, whereas the vast majority of fines (88.1%) were in the range of $300 to $1000. Those offenders sentenced to full-time imprisonment received a median term of three months, whilst almost a third (31.3%) were sentenced to only one month. These figures were similar to those
observed in 2002.
Licence disqualification: 71.4% of offenders were disqualified from holding a driver’s licence (down 5.0 percentage points since 2002). The median disqualification period was 12 months, which was also the mode (80%). A further 18.0% were disqualified for two years.
8. Maliciously destroy or damage property
Crimes Act 1900, s 195(1)(a). Maximum penalty in the Local Court: 20 pu or imprisonment for 12 months or both (property value does not exceed $2000); 50 pu or imprisonment for 12 months or both (property value does not exceed $5000); 100 pu or imprisonment for 2 years or both (property value exceeds $5000).
Fines and s 9 good behaviour bonds were the most common penalties for this offence. However, since 2002, there has been less reliance on fines (down 9.0 percentage points from 48.6% to 39.6%) and greater reliance on s 9 bonds (up 8.7 percentage points from 18.8% to 27.5%). Non-conviction orders under s 10 continued to be frequently used, with 13.6% of offenders conditionally discharged (bond) and a further 7.1% of offences unconditionally dismissed. Full-time imprisonment was imposed in 4.9% of cases, CSOs in 2.9% and suspended sentences in 2.5%.
The median fine amount was $400 (up from $300 in 2002), and the mode was $500 (18.3%). Other common fine amounts were $400 (17.5%) and $300 (16.3%). Almost three-quarters of fines (74.0%) were in the range of $200 to $500. The median term of full-time imprisonment was three months, whilst terms of one month accounted for 30.1% of full-time prison sentences.
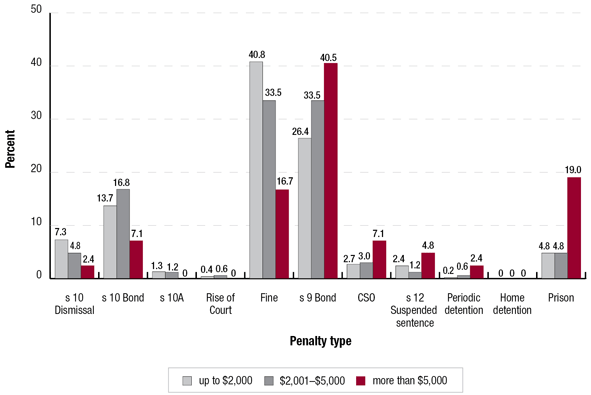
Most offences (93.2%) involved property worth up to $2000,29 with sentences for this group closely resembling the overall patterns for this offence. Offences in the upper band (property worth more than $5000) accounted for only 1.4% of cases. As Figure 3 shows, these offenders received more serious penalties on average, with 19.0% sentenced to full-time imprisonment and only 16.7% receiving fines. They also attracted higher rates of periodic detention (2.4%), suspended sentences (4.8%), CSOs (7.1%) and s 9 good behaviour bonds (40.5%).
Outcomes within sentence types were also more severe where property involved was of greater value. Offences in the upper band attracted a median fine of $500 and a median term of full-time imprisonment of 10.5 months, whereas offences in the lower band attracted a median fine of $400 and a median full-time prison term of three months. Offences in the middle band (property worth more than $2000 but not
more than $5000) attracted a median fine of $500 and median term of full-time imprisonment of 5.5 months.
Figure 3: Distribution of penalty types for maliciously destroy or damage property offenders sentenced in the NSW Local Court in 2007 according to the value of property
 9. Never licensed person drive on road
Road Transport (Driver Licensing) Act 1998, s 25(2). Maximum penalty: 20 pu (first offence); 30 pu or imprisonment for 18 months or both (second or subsequent offence) [mandatory minimum licence disqualification 3 years].
Non-custodial sentences were imposed in the overwhelming majority of cases (99.5%). Over three-quarters of offenders received a fine (77.3%), with a median of $400, and a mode of $500 (18.2%).
Just over half the fines (51.0%) were in the range of $300 to $500. Conditional discharge (bond) under s 10 was ordered in 5.5% of cases, whilst 7.2% of offences were unconditionally dismissed. Good behaviour bonds under s 9 were ordered in 6.8% of cases, and CSOs in 1.2%. Suspended sentences were imposed on only 0.7% of offenders, full-time imprisonment on 0.3% and periodic detention on 0.2%. This offence attracted one of the lowest rates of full-time imprisonment, which is at least partly explained by the lack of custodial sentencing options for first offenders.
Licence disqualification: 40.8% of offenders were disqualified from holding a driver’s licence. Mandatory disqualification only applies to second or subsequent offences. The median and mode (78.1%) disqualification period was three years, being the minimum period of disqualification.
10. Assault occasioning actual bodily harm
Crimes Act 1900, s 59(1). Maximum penalty in Local Court: 50 pu or imprisonment for 2 years or both.
This offence attracted the lowest rate of fine outcomes in the list (11.2%) and the fourth highest rate of full-time imprisonment (14.5%). It also attracted the second highest rate of suspended sentences (10.4%) and higher than average rates of periodic detention (2.1%) and CSOs (7.5%). The most common penalty imposed was a s 9 good behaviour bond (44.6%, the highest rate in the list). Since 2002, there has been a decrease of 5.4 percentage points in the use of fines and 2.9 percentage points in the use of s 10 non-conviction orders. This has been offset by an increase of 7.5 percentage points in the use of s 9 bonds and 2.4 percentage points in the use of imprisonment.
The median fine amount was $600, and the mode was $500 (20.1%). Almost two-thirds of fines (64.7%) were in the range of $500 to $1000. The median term of full-time imprisonment was 12 months (up from nine months in 2002), which was also the mode (26.1%). As mentioned above, this is double the median full-time prison term for “common assault” (see above at item 2 in the list).
11. High-range PCA
Road Transport (Safety and Traffic Management) Act s 9(4). Maximum penalty: 30 pu or imprisonment for 18 months or both (first offence) [automatic licence disqualification 3 years, minimum 12 months]; 50 pu or imprisonment for 2 years or both (second or subsequent offence) [automatic licence disqualification 5 years, minimum 2 years].
There has been a dramatic change in sentencing patterns for this offence when compared with 2002 statistics. In 2004 the NSW Court of Criminal Appeal promulgated a guideline judgement for this offence. The court held that in an ordinary case of an offence of high-range PCA, an order under s 10 will rarely be appropriate. In an ordinary case of a second or subsequent high-range PCA offence, an order under s 9 will rarely be appropriate; an order under s 10 would very rarely be appropriate; and where the prior offence was for a high-range PCA, any sentence of less severity than a community service order would generally be inappropriate.30
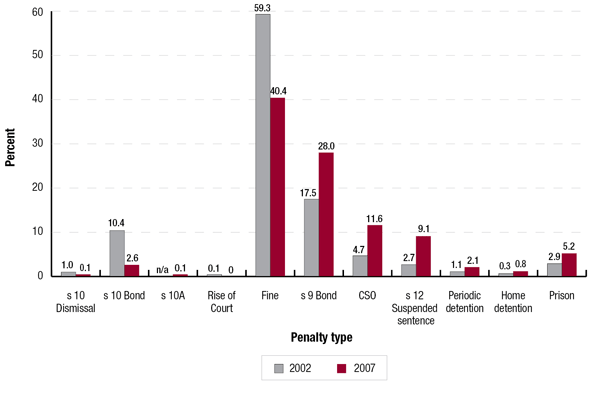
As Figure 4 shows, there has been a marked increase in the use of custodial sentences in the 2007 statistics (8.1% compared with 4.3% in 2002). There has been a reduction in the use of fines (40.4% compared with 59.3% in 2002), and an increase in the use of s 9 good behaviour bonds (28.0% compared with 17.5%), CSOs (11.6% compared with 4.7%), suspended sentences (9.1% compared with 2.7%) and full-time imprisonment (5.2% compared with 2.9%). This offence also attracted higher than average rates of periodic detention (2.1%) and home detention (0.8%). Conditional discharges (bond) and unconditional dismissals under s 10 together accounted for only 2.7% compared with 11.4% in 2002.
The median fine amount was $1000 (unchanged since 2002), which was also the mode (15.8%). Over three-quarters of fines (79.0%) were in the range of $500 to $1500. The median term of full-time imprisonment was ten months (up from seven months in 2002), whilst terms of 12 months accounted for 31.7% of full-time prison sentences.
Licence disqualification: The overwhelming majority of offenders (97.2%) were disqualified from holding a driver’s licence (compared with 88.3% in 2002). This is the highest rate of any offence in the list. The median term of disqualification was two years (up from 18 months in 2002), and the mode was 12 months (28.3%). A further 24.6% were disqualified for three years, 19.8% for two years and 5.2% for five years.
Figure 4: Distribution of penalty types for high-range PCA offenders sentenced in the NSW Local Court in 2002 and 2007
 12. Drive without being licensed
Road Transport (Driver Licensing) Act 1998, s 25(1). Maximum penalty: 20 pu.
The vast majority of offenders received a fine for this offence (81.2%). This was the highest rate of fine-only outcomes in the list, with a median value of $400, and a mode of $500 (18.7%). Over two-thirds of fines (68.3%) were in the range of $200 to $500.
The next most common penalty was an unconditional dismissal under s 10 (10.9%), followed by a conditional discharge (bond, 3.3%). A further 2.7% of offenders received s 9 good behaviour bonds,
whilst 1.3% were convicted with no other penalty recorded. Since 2002, there has been an increase in the use of s 10 non-conviction orders (from 11.2% to 14.2%).
Licence disqualification: 21.2% of offenders were disqualified from holding a driver’s licence, compared with 29.0% in 2002. The median term of disqualification was 12 months (down from 18 months in 2002), and the mode was three years (38.3%). A further 22.4% were disqualified for 12 months.
13. Knowingly contravene AVO
Crimes Act 1900, s 562I(1) (repealed 12 March 2007) and s 562ZG(1) (substantively re-enacting s 562I(1)). Maximum penalty: 50 pu or imprisonment for 2 years or both.
Statistics for this offence reveal a sentencing pattern similar to the various offences against the person appearing in the list. The legislation provides that where an offence involves violence against a person, there is a presumption that a sentence of imprisonment will be imposed, and that the court must provide
reasons if it declines to do so.31
This offence attracted a high rate of s 9 good behaviour bonds (33.5%), terms of full-time imprisonment (16.4%, the second highest rate in the list) and suspended sentences (10.3%, the third highest rate in the list). The proportion of fines (20.6%) was relatively low compared with other offences in the list. These findings are consistent with the legislative scheme, and indicate that the offence is treated seriously by the Local Court.
The severity of penalties for this offence has increased since 2002. The proportion of offenders receiving full-time imprisonment and s 9 bonds has increased by 5.2 percentage points and 3.6 percentage points respectively. This has been offset by a reduction of 7.3 percentage points in the use of fines and 3.1 percentage points in the use of s 10 non-conviction orders.
The median fine was $300, and the mode $500 (17.3%). Almost three-quarters of fines (73.2%) were in the range of $200 to $500. The median term of full-time imprisonment was six months (up from 4.5 months in 2002), and the mode was 12 months (20.4%). Terms of one month were imposed on 18.8% of offenders sentenced to full-time imprisonment.
14. Offensive conduct
Summary Offences Act 1988, s 4. Maximum penalty: 6 pu or imprisonment for 3 months.
The majority of offenders sentenced for this offence received a fine (65.8%). A further 17.6% of offences were unconditionally dismissed under s 10 (the second highest rate in the list), whilst 8.1% of offenders were conditionally discharged (bond) and 5.7% were dealt with by way of a s 9 good behaviour bond. Convictions were recorded with no other penalty in 1.5% of cases, and terms of full-time imprisonment imposed in only 0.9% of cases.
The severity of penalties was below the overall average, with a median fine of $250 and a mode of $300 (20.7%). Fines of $200 were also common (18.9%). Almost half the fines (47.4%) were in this range, whereas the vast majority of fines (93.9%) were in the range of $100 to $500. The median term of full-time imprisonment was two months, and the mode was one month (40.9%). Terms of two months were imposed on 36.4% of offenders sentenced to full-time imprisonment. This reflects the relatively light maximum penalties.
Generally, these penalties were similar to those recorded in 2002. However, the median fine was slightly higher (up from $200). Too few offenders were given full-time imprisonment to make any meaningful comparison.
15. Assault with intent on certain officers
Crimes Act 1900, s 58. Maximum penalty in Local Court: 50 pu or imprisonment for 2 years or both.
The most common penalty for this offence was a s 9 good behaviour bond (35.4%, the third highest rate in the list). Fines accounted for 30.8% of sentences, full-time imprisonment for 9.7%, and conditional discharge (bond) under s 10 for 7.9%. A further 2.3% of offences were unconditionally dismissed. Suspended sentences accounted for 6.6% of offenders, and CSOs for 5.9%. Since 2002, there has been a decrease of 9.7 percentage points in the use of fines and a correlative increase of 9.7 percentage points in the use of s 9 bonds.
The median fine was $400, and the mode was $500 (20%). Almost three-quarters of fines (72.9%) were in the range of $200 to $500. The median term of full-time imprisonment was five months (up from four months in 2002), with two modes of three months and six months (16.5%).
16. Drive unregistered vehicle
Road Transport (Vehicle Registration) Act 1997, s 18(1). Maximum penalty: 20 pu.
Sentencing patterns for this offence were similar to those for the next offence in the list, “negligent driving (not occasioning death or grievous bodily harm)” and similar to the sentencing patterns observed in 2002. The most common penalty was a fine (78.2%), followed by unconditional dismissal under s 10 (18.6%) and conviction with no other penalty (2.4%). This represents the highest rates of both s 10A outcomes and s 10 unconditional dismissals for any offence in the list.
The median fine amount was $300, and the mode $200 (14.2%). Fine amounts of $100 and $400 were almost as common (14.0% and 13.7% respectively). The vast majority of fines (89.7%) were in the range of $100 to $500.
Licence disqualification: Only three offenders were disqualified from holding a driver’s licence (0.1%), for three, 12 and 24 months respectively.
17. Negligent driving (not causing death or grievous bodily harm)
Road Transport (Safety and Traffic Management) Act 1999, s 42(1)(c). Maximum penalty: 10 pu.
As with “drive unregistered vehicle”, more than three-quarters of offenders were dealt with by a fine (78.9%). The second most common sentence was an unconditional dismissal under s 10 (16.4%, the third highest rate in the list), whilst 2.8% of offenders were conditionally discharged (bond). Convictions with no other penalty accounted for 1.0% of offenders, and s 9 good behaviour bonds for 0.7%. The median fine amount was $300 (up from $200 in 2002), which was also the mode (18.6%). The vast majority of fines (88.2%) were in the range of $100 to $500.
Since 2002, the use of a s 10 order to dismiss the charge (unconditionally) has declined by 4.8 percentage points. Other dispositions, particularly fines, have been used instead.
Licence disqualification: 5.0% of offenders were disqualified from holding a driver’s licence for a median term of six months. The mode was three months (27.7%) whilst a further 26.7% were disqualified for six months, and 17.8% for 12 months. These figures were similar to those recorded in 2002.
18. Offensive language
Summary Offences Act 1988, s 4A. Maximum penalty: 6 pu.
This offence carries the lightest maximum penalty of any offence in the list. The vast majority of offenders received a fine (81.1%). A further 11.0% of offences were unconditionally dismissed under s 10 and 5.6% of offenders were conditionally discharged (bond). Convictions with no other penalty were recorded in 1.6% of cases. While the combined figure for s 10 non-conviction orders has not significantly changed since 2002, fewer offences have been unconditionally dismissed (down 4.2 percentage points) and a greater proportion of offenders have been conditionally discharged (up 2.6 percentage points).
The median fine amount was $200, which was also the mode (20.8%). Over three-quarters of fines (78.1%) were in the range of $100 to $300.
19. Goods in custody
Crimes Act 1900, s 527C(1). Maximum penalty: 5 pu or imprisonment for 6 months or both; 10 pu or imprisonment for 12 months or both (where in possession of a motor vehicle, vessel or part thereof).
This offence attracted the highest rate of full-time imprisonment of any offence in the list (18.0%). However, terms were relatively short, with a median of three months, which was also the mode (25.0%), reflecting the relatively small maximum terms.
The most common penalty was a fine (38.9%) followed by a s 9 good behaviour bond (23.7%). Conditional discharges (bond) under s 10 accounted for 6.4% of offenders, with a further 2.4% of offences unconditionally dismissed. Suspended sentences were imposed on 5.7% of offenders, and CSOs on 3.2%.
The median fine amount was $400 and the mode was $500 (25.1%). Over three-quarters of fines (78.6%) were in the range of $200 to $500.
Although the use of certain dispositions (particularly full-time imprisonment and s 9 bonds) has increased, while others (particularly fines) have fallen, penalties for this offence did not differ significantly from those recorded in 2002.
20. Drive recklessly/furiously or at a speed or in a manner dangerous
Road Transport (Safety and Traffic Management) Act 1999, s 42(2). Maximum penalty: 20 pu or imprisonment for 9 months or both (first offence) [automatic licence disqualification 3 years, minimum 12 months]; 30 pu or imprisonment for 12 months or both (second or subsequent offence) [automatic licence disqualification 5 years, minimum 2 years].
The most common penalty for this offence was a fine (47.9%), followed by a s 9 good behaviour bond (21.2%) and a CSO (10.3%, the third highest rate in the list). Full-time imprisonment accounted for 9.5%
of offenders, whilst 5.2% received suspended sentences and 2.1% were ordered to serve periodic detention. Conditional discharges (bond) under s 10 were ordered in 3.0% of cases, whilst only 0.3% of offences were unconditionally dismissed.
Fine amounts were approximately double the overall average, with a median value of $900 and a mode of $1000 (24.7%). The vast majority of fines (82.6%) were in the range of $500 to $1500. Terms of full-time imprisonment were unexceptional, with a median of eight months, and a mode of nine months (18.3%). Full-time prison terms of 12 months were also common (17.4%).
Licence disqualification: The overwhelming majority of offenders (96.7%) were disqualified from holding a driver’s licence. The median period of disqualification was 18 months, and the mode was 12 months (38.0%). Most disqualification periods (94.8%) were in the range of 12 months to three years.
Regulatory Offences
A total of 25,432 offenders were sentenced in the Local Court for regulatory offences in 2007. This number accounted for 18.8% of all offenders sentenced in that year. Of these, 71.9% were dealt with by a fine only and 25.5% of offences were unconditionally dismissed under s 10. The median fine amount was $200, which was also the mode (10.8%). Fines of $100 were almost as common (10.3%). Around one in five fines (20.8%) were under $100 and almost three-quarters of fines (71.0%) were in the range of $100 to $500.
The vast majority of regulatory offenders (90.6%) were sentenced for road traffic and motor vehicle regulatory offences. This category accounted for 23,031 offenders, of which 91.1% were sentenced for
regulatory driving offences. More than a quarter of all regulatory offences (26.0%) were for “exceed speed limit”, accounting for 6620 offenders. This is more than the fourth most common statutory offence in the list, “drive whilst disqualified”. The second most common regulatory offence was “disobey no stopping/no standing signs” (6.9%). This offence accounted for 1763 offenders, more than the 18th most common statutory offence, “offensive language”.
The distribution of offenders sentenced for the 10 most common proven regulatory offences appears in Table 3. As mentioned above, these offenders have otherwise been excluded from the general analysis.
Table 3: Most common proven regulatory offences in the NSW Local Court in 2007
|
Rank
|
Offence
|
Regulation
|
Number of cases
|
% of cases
|
|---|---|---|---|---|
|
1
|
Exceed speed limit | Australian Road Rules, r 20 |
6,620
|
26.0
|
|
2
|
Disobey no stopping/no standing sign | Australian Road Rules, r 167 |
1,763
|
6.9
|
|
3
|
Fail to stop for red light or arrow | Australian Road Rules, r 56 |
1,083
|
4.3
|
|
4
|
Fail to hold valid ticket for train travel | Rail Safety (General Regulation 2003, r 5(1)(b) |
1,040
|
4.1
|
|
5
|
Drive using a hand held mobile phone | Australian Road Rules, r 300 |
747
|
2.9
|
|
6
|
Fail to comply with licence condition | Road Transport (Driver Licensing) Regulation 1999, r 56(1) |
726
|
2.9
|
|
7
|
Driver fail to wear seat belt properly adjusted/fastened | Australian Road Rules, r 264 |
518
|
2.0
|
|
8
|
Unlawfully use ticket in ticket parking area | Road Transport (Safety and Traffic Management) (Road Rules) Regulation 1999, r 66 |
516
|
2.0
|
|
9
|
Park for longer than indicated | Australian Road Rules, r 205 |
473
|
1.9
|
|
10
|
Stop in parking area for people with disabilities | Australian Road Rules, r 203 |
424
|
1.7
|
| Total for top 10 offences |
13,910
|
54.7
|
||
| All remaining offences |
11,522
|
45.3
|
||
| Total |
25,432
|
100.0
|
Conclusion
The overall distribution of the 20 most common offences in the Local Court for 2007 has not changed dramatically since 2002. Notable points of similarity include:
- Eighteen of the offences appearing in the 2007 list also appeared in the 2002 list. The two most common offences have not changed since 2002 (“mid-range PCA” followed by “common assault”).
- Four of the five most common offences in 2002 remain in the five most common offences for 2007. Three of these offences were also in the five most common offences for 1992.
- A total of six offences appearing in the 2007 list hold the same positions that they did in 2002.
- Offences relating to the use and operation of a motor vehicle continue to dominate the list.
Other than the two new offences appearing in the list, the most noticeable change of ranking and pattern of sentencing has been for the offence of “high-range PCA”, with:
- The offence dropping from the fifth most common in 2002 to the 11th in 2007.
- An increase in the use of penalties more severe than a fine (see Figure 4). These results confirm a 2005 Judicial Commission study which found that there has been a decline in the use by magistrates of s 10 dismissals and a general increase in the severity of penalties for the offence.32 This earlier study indicated that the trend was a result of the 2004 guideline judgment,33 together with related research and educational programs.34
The overall distribution of penalty types has also remained remarkably stable since 2002, with:
- Fines continuing to represent the most common sentencing outcome (48.2%), followed by good behaviour bonds under s 9 (18.0%). Non-conviction orders under s 10 accounted for 16.7% of all penalties imposed (10.5% conditionally discharged on a good behaviour bond and 6.2% unconditionally dismissed).
- Fines are even more widespread when regulatory offences are included in the count. The proportion of offenders given a fine as their primary penalty increases to 52.6%. The use of s 10 orders also rises to 18.6% (8.8% with good behaviour bond and 9.8% without).
- In a small number of cases (4.6%) fines were imposed in addition to other penalties. Of these, 92.8% were imposed in addition to a s 9 good behaviour bond.
Some changes in sentencing patterns since 2002 have been observed, including:
- An increase in the use of s 9 good behaviour bonds compared with 2002 (from 14.5% to 18.0%), and a decrease in the use of s 10 to unconditionally dismiss the charge (from 7.4% to 6.2%) and fines (from 50.2% to 48.2%). While these percentage changes may appear small, they account for a large number of individual cases dealt with in the Local Court.
- Rise of court declining in its use to an almost negligible frequency. This may in part be attributable to the introduction of s 10A, which allows the court to impose a similar outcome under the statutory scheme, namely the recording of a conviction without imposing any substantive penalty.
- While there has been little difference in the imposition of custodial penalties, there has been a noticeable increase in the duration of terms. The median full-time prison term increased from six months to eight months. The median term of periodic detention and home detention also increased from six months to eight months and nine months respectively.
- An increase in the proportion of offenders disqualified from holding a driver’s licence and longer periods of disqualification for all three PCA offences in the list.
Endnotes
1 Judicial Officers Act 1986, s 8(1)(b).
2 See J Keane and P Poletti, “Common offences in the Local Court”, Sentencing Trends & Issues, No 28, Judicial Commission of NSW, 2003; I MacKinnell, “Common offences in the Local Court” Sentencing Trends, No 5, Judicial Commission of NSW, 1994.
3 Comprising breaches of good behaviour bonds, community service orders, suspended sentences and the relevant Commonwealth counterparts. These cases are excluded on the basis that they are a “call-up” for a failure to comply with a judicial order, rather than an “offence” in the strict sense.
4 Sentencing data relating to most regulatory offences only became available from February 2003. Including them in the general analysis would make comparisons with 2002 and 1992 figures problematic.
5 The analysis is based on data as recorded in JIRS.
6 Terms of imprisonment (including home detention, periodic detention and suspended sentences) and good behaviour bonds are measured in months. Community service orders are measured in hours and monetary values are used for fines.
7 This may have in turn had a small effect on the overall distribution of penalties. In 2007, these breaches accounted for only 1.4% of all principal offences in the Local Court selected by BOCSAR.
8 NSW Bureau of Crime Statistics and Research, New South Wales Criminal Courts Statistics 2002, 2007, NSW Attorney General’s Department, Sydney, 2003, 2008, Table 1.7. BOCSAR figures also exclude most regulatory offences.
9 Section 195(a) of the Crimes Act 1900 was replaced with s 195(1)(a) on 15 December 2006.
10 Section 562I(1) of the Crimes Act 1900 was replaced with s 562ZG(1) on 12 March 2007.
11 Road Transport (Driver Licensing) Act 1998, s 25A(3).
12 Crimes Act 1900, s 112(1).
13 Compulsory drug treatment detention (s 5A) is only available in the Drug Court.
14 There were 2921 Commonwealth offences representing 2.7% of the total number of offences in 2007.
15 Fines can also be imposed with other penalties considered to be higher in the sentencing hierarchy. As this study only encompasses primary penalties, this figure does not include fines imposed in addition to other penalties. In 2007, there were 5082 fines imposed in addition to the primary penalty (4.6% of the total number of offenders sentenced). Of these, the overwhelming majority were imposed in addition to a s 9 good behaviour bond (92.8%). As a secondary penalty, the median fine amount was $600, substantially higher than for fines imposed as the only penalty. The most common fine amounts were $500 and $1000 imposed on 21.5% and 15.3% of offenders respectively.
16 See also s 20(1)(a) of the Crimes Act1914 (Cth) (conditional release). In almost a quarter of cases in which a s 9 bond was imposed (23.9%), a fine was also imposed.
17 See also s 19B of the Crimes Act 1914 (Cth) (discharge without proceeding to conviction).
18 A fine was also imposed on a small number of offenders sentenced to full-time imprisonment (0.2%).
19 Section 44(2) states that the balance of the term of the sentence must not exceed one-third of the non-parole period of the sentence (or put another way, the non-parole period must not be less than three-quarters of the full term of sentence).
20 Section 46 of the Act states that a court may not set a non-parole period for a sentence of imprisonment if the term of the sentence is six months or less. Section 45 provides that a court may decline to set a non-parole period if it appears appropriate to do so.
21 See also s 20(1)(b) of the Crimes Act 1914 (Cth) (recognisance release forthwith). In 4.3% of suspended sentences, a fine was also imposed.
22 In 2.8% of CSOs, a fine was also imposed.
23 In 1.6% of these cases, a fine was also imposed.
24 JIRS statistics provide a breakdown of the sentences imposed on offenders by prior record. An examination of JIRS clearly showed this to be the case for each offence in the list.
25 R v Rosenthal [2008] NSWCCA 149 at [16]–[17].
26 1 penalty unit is currently equivalent to $110: Crimes (Sentencing and Procedure) Act 1999, s 17.
27 Where the value of property was known. The property value was not known in 18.5% of larceny offences. The sentencing patterns for this group, however, closely resemble those where the value of property did not exceed $2000.
28 Where the type of drug was known. The type of drug was not known in 23 cases (or 0.5%).
29 Where the value of property was known. The property value was not known in almost a third of offences (30.9%). The sentencing patterns for this group, however, closely resemble those where the value of property did not exceed $2000.
30 Re Attorney General’s Application under Section 37 of the Crimes (Sentencing Procedure) Act 1999 (NSW) (No 3 of 2002) (2004) 61 NSWLR 305 at [146].
31 Crimes Act 1900 s 562I(2A) and (2C); s 562ZG(4) and (6).
32 P Poletti , “Impact of the high range PCA guideline judgment on sentencing drink drivers in NSW”,
Sentencing Trends & Issues, No 35, Judicial Commission of NSW, 2005, see at 5–6 and Figure 2 at 6.
33 Re Attorney General’s Application under Section 37 of the Crimes (Sentencing Procedure) Act 1999 (NSW) (No 3 of 2002) (2004) 61 NSWLR 305.
34 P Poletti, above n 32, at 18.


