


Sentencing Drink-Driving Offenders
by
Ian MacKinnell
Senior Project Officer
Introduction
The most common drink-driving offences in New South Wales are three “prescribed concentration of alcohol” (PCA) offences created by s.4E of the Traffic Act 1909. These three offences involve driving, or attempting to drive, with a blood alcohol concentration in one of the following ranges:
- at least 0.05 grams, but less than 0.08 grams, of alcohol in 100 millilitres of blood (low range PCA)
- at least 0.08 grams, but less than 0.15 grams, of alcohol in 100 millilitres of blood (middle range PCA)
- at least 0.15 grams of alcohol in 100 millilitres of blood (high range PCA)
These offences may be viewed as the product of developments in medical technology that allow accurate measurement of blood alcohol levels, along with breath-testing, as a routine procedure. Before such tests were readily available, drink-driving laws depended on the notion of “driving under the influence” (DUI), as found for example in s.5(2) of the Traffic Act and in some provisions of s.52A of the Crimes Act
1900 (this latter section was recently amended to take into account blood alcohol concentration as an aggravating factor). The PCA provisions, especially with the use of random breath testing, have enabled a more effective control of drink-driving than the older DUI offences, as evidenced by the significant reduction in the number of road fatalities following their introduction.
Definitions and Qualifications
The statistics presented in this paper refer to first instance PCA matters finalised in the Local Courts of New South Wales during a 3-year period from January 1992 to December 1994.
- The term “offence” in this paper refers to the principal offence in each case. The principal offence is the offence that received the most severe penalty. If another offence (for example, another driving offence) dealt with at the same time received a more severe penalty, the PCA offence has not been included in the data. The penalties for such offences may have been influenced by their association with a more serious offence.
- All cases have been excluded where the offender was sentenced to cumulative terms of imprisonment, because the actual term imposed for the PCA offence is likely to be influenced by the other term(s) imposed, and hence may not accurately reflect the normal sentencing pattern for PCA offences.
- The data has not been corrected to take account of variations made on appeal to the District Court or the Court of Criminal Appeal, as these constitute de novo hearings of the charges.
- The statistical data currently available does not distinguish offenders who previously committed a “major offence” as defined in section 2 of the Traffic Act. However, it is possible to identify offenders with a prior record in more general terms.
Incidence of PCA Offences
As noted in a previous issue of Sentencing Trends
(‘Common Offences in the Local Court’), middle and high range PCA are the two most common offences dealt with in the Local Courts, and low range PCA also falls among the “top twenty” offences in that jurisdiction.
Furthermore, owing to the general popularity of alcohol consumption and the practice of most adults to possess a driver’s licence, these three offences are among the criminal provisions that the average citizen is most likely to breach and, as a result, end up in court.
Over the last three years
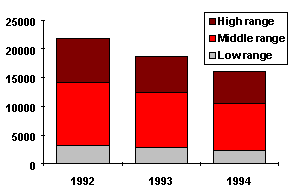
The number of cases of low, middle and high range PCA fell significantly over the period from 1992 to 1994. Both low and middle range PCA declined by 26% in that period, and high range by 29%.
Across the State
Over the whole of New South Wales, about 51% of PCA offences fell in the middle range, 34% in the high range, and 15% in the low range. However, these proportions vary across the State:
- the proportion of PCA cases falling in the high range was significantly greater than average for offenders residing in the Western Plains (47%), Broken Hill (45%), New England (40%), the Murray region (39%), the Southern Tablelands (39%), and the Riverina (38%).
- the proportion of PCA cases falling in the high range was significantly lower than average for offenders residing in the Northern Suburbs (28%), the Canberra/Queanbeyan area (28%), and in the Eastern Suburbs (30%).
- generally speaking, the proportion of PCA offences falling in the high range was below the State average (34%) in the Sydney metropolitan area, and above the State average in country areas. The Central Coast, Hunter Region and South Coast all fell in the range 33-34% (ie. about average).
- Within the Sydney metropolitan area, the South-Western Suburbs had the highest proportion of PCA offences falling in the high range (35%).
The differences noted above between city and country areas, and between North/East Sydney and South-Western Sydney, suggest that there are broad socio-economic differences in drink-driving behaviour.
Offender Profile
The typical PCA offender, as is the case for most other crimes, is a young male, and may well have a prior record of some kind. PCA offenders nearly always plead guilty, and usually have legal representation; they also usually have no other convictions at the same hearing. There are, however, significant differences between high, middle and low range PCA offenders in terms of many of these characteristics.
Sex
Around 86-89% of PCA offenders were males. Low range PCA had the highest proportion of females (14%) and high range the lowest (11%). These figures indicate that female offenders, on average, have a lower blood alcohol level than male offenders.
Age

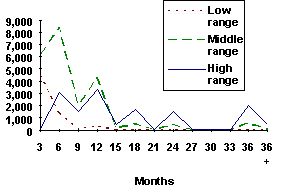
The most common age group of offenders was 20-24 years, followed by 25-29 years. However, as the following graph shows, the proportion of offenders with a high blood alcohol concentration is greatest for the 40-44 and 35-39 year age groups.
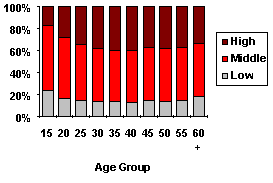
These statistics indicate that, while younger drivers are more likely to commit drink-driving offences, the older drivers convicted of drink-driving tend to have higher blood alcohol levels.
Multiple offences
It is not uncommon for an offender to be convicted of several offences at the same hearing (eg. a PCA offence plus another driving offence, such as exceeding the speed limit, negligent driving, etc even a second PCA offence).
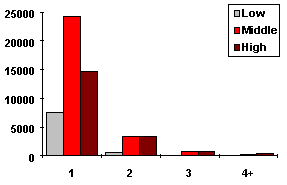
The graph above shows the number of offences for which offenders were convicted when their PCA offence was dealt with. While the vast majority of offenders were convicted of only one offence (ie. the PCA offence), 24% of high range PCA offenders, 16% of middle range PCA offenders, but only 10% of low range PCA offenders, were found guilty of other offences at the same hearing as their PCA offence.
Prior record
Where low or high range PCA offenders have been convicted of a major driving offence in the previous five years, they are liable to greater maximum penalties. Unfortunately, the statistics currently collected from the Local Courts do not distinguish these offenders, but they do indicate whether an offender has a prior criminal record in general.
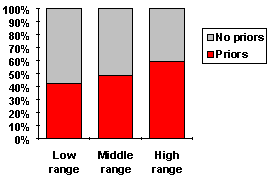
The majority of high range PCA offenders had a prior criminal record of some kind (59%), while a slight majority of middle range PCA offenders (52%) and a larger proportion of low range PCA offenders (58%) had no prior record of any kind. Overall, the proportion of PCA offenders with a prior record of some kind was 51%.
Plea
Nearly all offenders convicted of PCA offences pleaded guilty (96%), and there was no significant differences between low range, middle range and high range PCA offenders in this respect (eg. the proportion of low range PCA offenders pleading guilty was 96.5% and of high range PCA offenders the proportion was 96.1%)
Legal representation
About two-thirds of PCA offenders were reported as having legal representation when their case was dealt with in the Local Court. This proportion is greatest for offenders convicted of high range PCA (71%), and least for low range PCA (56% ); the proportion for middle range PCA was 62%. As will be evident later in this paper, it is possible to compare the sentencing outcomes of those offenders who had legal representation with those who did not.
Penalties
As the following graph shows, the most common penalty imposed for PCA offences was a fine, regardless of whether the offence was in the low, middle or high range.
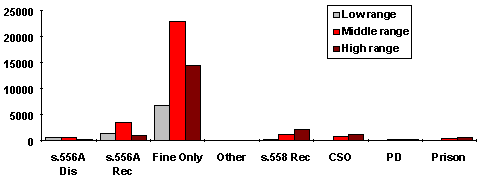
- for low range PCA, 78% of offenders received a fine, 14% received a s.556A recognisance, and 6% received a s.556A dismissal. CSOs, prison, and periodic detention are not available for this offence.
- for middle range PCA, 79% received a fine, 12% received a s.556A recognisance, and 4% received a s.558 recognisance.
- for high range PCA, 74% of offenders received a fine, 11% received a s.558 recognisance, 6% received a CSO, and 5% a s.556A recognisance.
Although custodial penalties are available for high and middle range PCA offences, they are used in only about 1% of middle range PCA offences and in about 3% of high range offences. (Note: the exclusion of cumulative sentences from the data used in this paper will affect these proportions to some extent, although not markedly).
The following analysis will concentrate on fine amounts and, for those who received fines, on the duration of drivers licence disqualifications.
Fines
The maximum penalties for PCA offences are as follows:
- low range PCA: $500 for a first offence, and $1,000 for a second or subsequent offence (ie. if the offender was convicted of a major driving offence in the previous five year period).
- middle range PCA: $1,000 (and/or 6 months imprisonment).
- high range PCA: $1,500 (and/or 9 months imprisonment) for a first offence; and $2,000 (and/or 12 months imprisonment) for a second or subsequent offence.
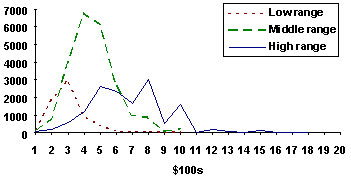
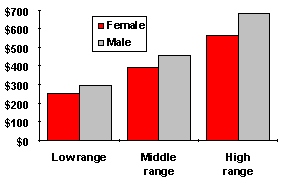
The graph above shows the distribution of fines for the three PCA offences, rounded up to the nearest $100.
- The average fine for low range was $290.
- The average fine for the middle range was $450.
- The average fine for the high range was $669.
The average fine has not changed significantly in the three year period of the data examined for this paper.
It should be noted that the amount of the fine reflects many factors besides the maximum penalty for the particular PCA range: eg. prior record, the capacity to pay, the likelihood of future offending. Some of these characteristics, or factors relevant to them (such as age and sex), are recorded in the statistics collected from the Local Courts, and it is possible to analyse fine amounts in greater detail, taking into account such factors.
Prior record
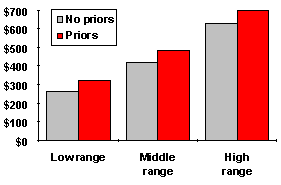
Of the various factors considered in this paper, the most important factor determining the amount of fines, apart from the level of PCA itself, is prior record. The above graph, which displays average fines, shows that there is a consistent tendency to impose larger fines on offenders with prior criminal records of some kind:
- Low range PCA: the average fines are $264 for offenders with no prior records, and $319 for those with priors.
- Middle range PCA: $419 (no priors) and $480 (with prior record).
- High range PCA: $629 (no priors) and $700 (with prior record).
Sex
The sex of the offender may be relevant for sentencing in a number of ways. As women, on average, have lower weekly earnings than men, they would have a lesser capacity to pay fines. Secondly, women are rather less likely to be convicted of PCA offences, and – when they are convicted – tend to have lower blood alcohol levels than male offenders. This might indicate a greater need for general deterrence among male offenders than female offenders.
The difference between average fines for males and females is greater for high range PCA (males: $682, and females: $563 – about $120 difference) than for low or middle range (middle range – males: $458, and females: $392 – about $66 difference; and low range – males: $295, and females: $249 – about $46 difference).
Age Group
Offender age is relevant to sentencing for broadly similar reasons as sex: capacity to pay and the likelihood of offending vary significantly with the age of the offender.
For the purposes of analysis, offender ages have been classified into four categories following the practice of the Sentencing Information System
(SIS): (A) up to 20 years of age; (B) 21-30 years; (C) 31-40 years; (D) over 40 years.

It might be argued that young offenders are more likely than older offenders to have no prior record, and hence would be expected to receive lower fines. However, even when prior record is taken into account, offenders in each PCA range aged 20 years and under receive significantly lower fines than older-aged offenders. The age group which, on average, receives the largest fines are those aged 31-40 years.
Legal representation
Of all the factors considered here, whether the offender had legal representation had the least impact on fine outcomes. For low range PCA, the average difference in fines between those with and those without legal representation was only $3; for middle range PCA it was $5, and for high range $7.
Disqualifications
When offenders are convicted of PCA offences, they are automatically liable to licence disqualification for the following periods (s.10A of the Traffic Act):
- low range PCA: 6 months for a first offence (ie. where the offender has not been convicted of a major driving offence in the previous 5 years), unless the court orders a shorter period; and 12 months for a second or subsequent offence, unless the court decides to impose a longer or shorter period of disqualification (however, such a period cannot be less than 3 months).
- middle range PCA: the same provisions as for a second or subsequent conviction for low range PCA.
- high range PCA: 3 years for a first offence, unless the court decides to impose a shorter or longer period (but not less than 6 months); and 5 years for a second or subsequent offence, unless the court decides to impose a shorter or longer period (but not less than 12 months).
While the Traffic Act
specifies default periods of licence disqualification for each PCA range as outlined above, the courts explicitly set a different period for many offenders. When the court imposes one of the more severe penalties (eg. a CSO), the average licence disqualification period tends to be longer as well. This is especially the case where the offender is sentenced to a term of imprisonment: magistrates take into account the term of imprisonment when setting a period of disqualification, to ensure that the offender serves an appropriate period of disqualification after release from gaol.
Secondly, the court takes into account the effect of a period of disqualification on the offender’s employment. Many offenders, especially those found guilty of low range PCA, are not convicted but dismissed under s.556A of theCrimes Act
(the discussion on page 4 above showed about 20% of offenders found guilty of low range PCA were dismissed or entered into a recognizance pursuant to s.556A, without a conviction being recorded). These offenders generally do not incur a licence disqualification, often in recognition of the fact that a licence disqualification might have an impact out of all proportion to the gravity of the offence. Similarly, a magistrate may allow an offender to continue driving only for limited purposes, eg. to and from the offender’s place of employment.
Because the principal penalty (fine, CSO, imprisonment, s.556A, etc) has an impact on the period of disqualification, the following analysis of licence disqualification periods is restricted to those offenders who were principally punished by way of a fine. As was the case for fine amounts, the most important factors in determining the period of the licence disqualification were the PCA range and prior record. Unlike fines, however, age was more significant than sex – young drivers tend to be punished by smaller fines, but significantly longer periods of licence disqualification, than older offenders. Whether the offender had legal representation also has some impact on the period of licence disqualification, although rather less than the other factors considered.
- of low range PCA offenders who were fined, 70% were disqualified for 3 months or less, and 22% for 4-6 months. Most of the remainder were disqualified for 12 months (5%). The average period was 3.5 months.
- of middle range PCA offenders who were fined, 27% were disqualified for 3 months, 37% for 4-6 months, 9% for 7-9 months, and 19% for 10-12 months. The average period was 7.9 months.
- of high range PCA offenders who were fined, 23% were disqualified for 6 months, 34% for 7-12 months, 12% for 18 months, 11% for 2 years, and 14% for 3 years. The average period was 17.3 months.
Prior record

The average period of licence disqualification was:
- low range PCA: 2.8 months (with no priors); and 4.3 months (with priors).
- middle range PCA: 6.4 months (with no priors); and 9.4 months (with priors).
- high range PCA: 14.6 months (with no priors); and 19.4 months (with priors).
Age
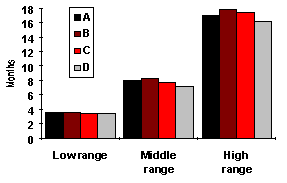
The graph above shows average fines by age group. The age groups are the same as those identified on page 5. The period of licence disqualification was shorter for older offenders, particularly those over 40 years of age. However, the age differences were slight for low range PCA.
Sex
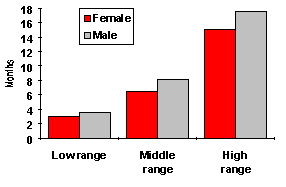
The period of licence disqualification was shorter on average for females.
Legal representation
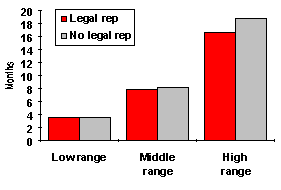
The period of licence disqualification was shorter on average for offenders with legal representation. The differences were very slight, however, for low range PCA. In general, one would expect that legal representatives would be more effective in presenting mitigating factors to the court, such as the effect of licence disqualification upon employment. Nevertheless, the effect of having legal representation was less marked than the other factors considered in this paper.
In Summary
When persons are found guilty of PCA offences, they receive the following penalties on average:
- low range: $290 fine and 3.5 months licence disqualification.
- middle range: $450 fine and 7.9 months licence disqualification.
- high range: $669 fine and 17.3 months licence disqualification.
Prior record and other factors, such as age and sex, have an effect on the penalties imposed, with males generally receiving higher penalties than females; offenders aged 21-30 receiving higher penalties than older or younger offenders; and, of course, those with a prior record receiving higher penalties than those without priors.
Conclusion
This paper has attempted to answer the question “What penalty will an offender receive if found guilty of a PCA offence?” The answer to this question was seen to vary in accordance with a number of factors, principally those that the Traffic Act
stipulates in setting the maximum penalty: the range of PCA, and the offender’s prior record. Several other factors were shown to be significant, including the age and sex of the offender, and even whether the offender had legal representation.
Penalties, however, vary through a broad range as a result of many other factors that have not, or cannot, be considered here: eg. more precise details about the offender’s prior record, the offender’s occupation or income level, whether the offender was convicted of other driving offences at the same time, the likelihood of further offending, the availability of non-penal options (eg. attendance at alcohol counselling centres), and so on. Moreover, the present paper has not attempted to unravel the sometimes complex relationships between these factors (eg. guilty plea might be a significant consideration for low range PCA, but much less so for high range PCA).
It should also be pointed out that penalties alone do not provide the answer to the reduction of drink-driving. The likelihood of being caught, rather than the precise amount of the penalty, is a major factor in deterring drink-driving – hence the widespread use and success of random breath testing. Secondly, advertising campaigns to change popular attitudes to drink-driving play a major role in reducing peer pressures, particularly on younger drivers, to engage in drink-driving. Finally, if a driver very rarely drinks to excess, the probability of being tested when they are over .05, and consequently found guilty of an offence, is very low. It follows, then, that a conviction for a PCA offence, particularly in the high range, may indicate that the offender is a regular heavy drinker, and stands in need of alcohol counselling in addition to, or instead of, penalties. It can be seen, then, that the penalties for PCA offences investigated in this paper form part of a wider strategy to reduce traffic accidents and fatalities.
Further Reading
‘Random Breath Testing in New South Wales’, P Grabosky & M James, The Promise of Crime Prevention. Canberra, Australian Institute of Criminology, 1995, pp 20-21.
R Homel, ‘Drink driving law enforcement and the legal blood alcohol limit in New South Wales’, Accident Analysis and Prevention, vol 26, pp 147-155.
R Homel, Policing and Punishing the Drinking Driver: A Study of General and Specific Deterrence. New York, Springer-Verlag, 1988.
R Homel, D Carseldine & I Kearns, ‘Drink driving countermeasures in Australia’, Alcohol, Drugs and Driving, vol 4, no 2, pp 113-144.
| Disclaimer |
|---|
| This paper was prepared by an officer of the Judicial Commission for the information of the Commission and for the information of judicial officers. The views expressed in the report do not necessarily reflect the views of the Judicial Commission itself but only the views of the officer of the Commission who prepared this report for the Commission. |
| Forthcoming Publications |
|---|
|
| Judicial Commission of New South Wales GPO Box 3634 Sydney 2001 |
Level 5 Wynyard House 301 George Street Sydney 2000 |
Chief Executive Ernest Schmatt |
Tel. (02) 9299 4421 Fax. (02) 9290 3194 |
ISSN 1036 4722