|
Sentencing Trends |
||
|
|
An Analysis of New South Wales Sentencing Statistics |
|
|
Published by the Judicial Commission of New South Wales |
||
|
Editor – Ivan Potas – Research Director |
||
|
Number 19 – February 2000 |
||
Sentencing Offenders in the Local Courts — Effects of the Criminal Procedure Amendment (Indictable Offences) Act 1995
Introduction
In response to a 1992 Bureau of Crime Statistics and Research Report1, and in an effort to provide for the more efficient use of District Court time2, the Criminal Procedure Amendment (Indictable Offences) Act 19953(hereafter the Amendment Act) revised the procedures under which certain indictable offences were to be dealt with summarily by the Local Courts. The Act commenced on 1 September 1995, whereupon Part 9A was inserted into the Criminal Procedure Act 1986, creating, inter alia, what have become known as Table 1 and Table 2 offences4.
Both tables set out indictable offences which are to be dealt with summarily, unless certain conditions are met. Table 1 provides for an “election of forum”, whereby either the accused or the prosecuting authority can elect to have a matter dealt with by indictment. Table 2 sets out offences for which only the prosecuting authority may elect to proceed by indictment5.
Pre-1995 arrangements
The Amendment Act did not introduce a completely unique regime. Pursuant to s 476 of the Crimes Act 1900 certain indictable offences could be dealt with summarily with the consent of the accused. By contrast, ss 495 through to 500 of the Crimes Act 1900 provided for certain offences to be dealt with summarily without the consent of the accused6. Prior to the 1995 amendments, discretion to hear such matters rested with the Local Courts7.
The Attorney General stated in the Second Reading Speech to the Legislative Council that the Government would “ keep under careful review also the issue of Local Court workload problems“8.
In 1998 Table 1 and Table 2 offences accounted for over one-quarter of the criminal case load for the Local Courts9. Just under one-half of all criminal matters dealt with in the District Court in 1998 were Criminal Procedure Actmatters10.
The purpose of this paper is to examine the impact of these amendments on the offences being dealt with by Local Courts, and the types of penalties being imposed.
Methodology
One measure of the impact of the 1995 amendments is to compare the percentages of sentencing matters dealt with11 in each jurisdiction, with a view to ascertaining the extent to which the Local Court’s share has increased since the amendments.
A second measure is to determine whether the penalties imposed in the Local Courts have become more severe12.
In order to undertake this task, offences were divided into four categories. The first category includes those offences newly inserted into either Table 1 or Table 2 in 1995. This incorporates such offences as cultivate prohibited plant13, stalking/intimidation, and demand money with intent to steal14. Certain firearms offences are also included15. The second category includes offences such as malicious damage, larceny as bailee and obtain money etc by deception16. These offences appear in both tables and were previously set out in ss 476 or 496 of the Crimes Act 1900 prior to the 1995 amendments. Thirdly, offences previously set out in s 476 of the Crimes Act 1900, which were inserted into Table 1, are examined, and include offences such as malicious wounding, aggravated indecent assault and robbery17. The fourth category embodies offences set out in Table 2 which previously appeared in s 496 (or its equivalent). Such offences include assault occasioning actual bodily harm, common assault, and taking conveyance without consent of owner18.
Overview
Figure 1 represents the percentage of all penalties for all criminal offences dealt with in the District Court, from January 1990 to December 1998, which could have been imposed by a Local Court19.
Figure 1
Percentage of penalties imposed by the District Court (1990-1998) falling within the jurisdiction of the Local Courts.
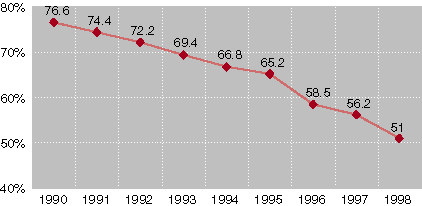
For the overall period, Figure 1 depicts a significant decrease in the proportion of matters sentenced in the District Court which may have been dealt with at Local Court level (76.6% in 1990, to 51% in 1998). Further, between 1995 and 1996, a pronounced decrease in the proportion of penalties which could have been imposed at Local Court level is evident, indicative of changes introduced by the Amendment Act.
Statistics maintained by the Judicial Commission indicate that the overall proportion of Table 1 and Table 2 offences sentenced in the Local Courts has increased by approximately 2% between 1995 and 1998. This relatively small percentage increase accounts for quite a large increase in the number of individual cases being dealt with at the Local Court level20.
Whilst it is not possible to differentiate between the parties choosing to have matters heard in the District Court, it is possible to presume that some positive election has been made in order for the matter to have been dealt with at District Court level. This may largely be attributable to the added discretion vested in the Office of the Director of Public Prosecutions, as opposed to that formerly resting with the Magistrates of the Local Courts under the pre-1995 regime.
Figure 2 depicts the proportion of Table 1 and Table 2 matters sentenced in the Local Courts. A 1.8% increase is observed for the period 19951996. Only a minimal change can be observed for the period 19961998 (0.2%), indicating that the Amendment Act may have had a significant initial effect upon the distribution of matters between the courts.
Figure 2
Percentage of Table 1 and Table 2 matters (or their equivalent) dealt with in the Local Courts (19931998)
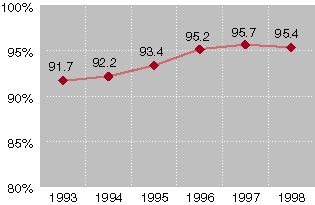
The total number of Table 1 and Table 2 matters dealt with in the Local Courts in 1993 (n=24,752) is almost equivalent to the number dealt with in 1998 (n=24,775). However, a large increase was observed between 1995 (n=23,902) and 1996 (n=25,660), corresponding in time with the passage of the Criminal Procedure Act 1995. By contrast, over the same period, the number of Criminal Procedure Act matters being sentenced in the District Court almost halved (1993: n=2,232; 1998: n=1,199), with a corresponding drop of almost 400 matters between 1995 (n=1,694) and 1996 (n=1,307).
It would be expected that if the 1995 Criminal Procedure Act amendments were to shift matters from the District Court to the Local Courts, a corresponding increase in the severity of penalties would be observed in the sentencing data of the Local Courts. This is because the matters being “transferred” from the District Court would likely constitute the more serious matters ordinarily dealt with at Local Court level. This assertion is supported by a Bureau of Crime Statistics and Research report which records an overall increase in the use of imprisonment as a sanction at the Local Court level for 199821.
Figure 3
Local Courts: penalty types for all Table 1 and Table 2 offences (or equivalent) (19931998)
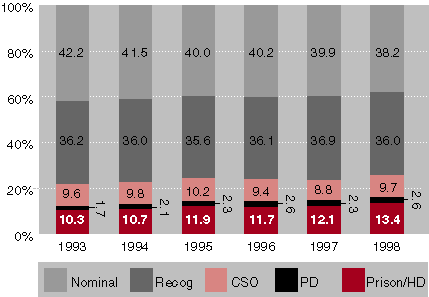
Figure 3 indicates that, since the 1995 amendments, there has been an increase in the use of custodial penalties for those offences appearing in Tables 1 and 2. Because this shift is only very slight, this trend appears to indicate that the severity of sanctions imposed by the Local Courts did not increase as a direct result of the amendments.
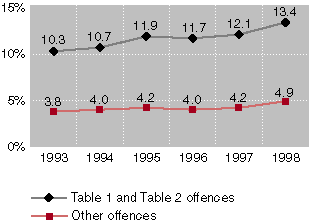
However, an examination of offences not found in Tables 1 or 2 reveals that sentences for these offences have remained fairly constant. This indicates that the observable pattern of more severe penalties being imposed in the Local Courts may be directly attributable to the creation of Table 1 and Table 2. This trend is depicted in Figure 4, representing Local Court imprisonment rates22 for the period 19931998.
Figure 4
Local Courts: imprisonment rates (19931998)
New Table 1 and Table 2 Offences
For those offences newly inserted into either Table 1 or 2 by the 1995 amendments, the Judicial Commission’s statistics reveal a marked decrease in the numbers of cases dealt with in the District Court (n=445 in 1993; n=115 in 1998), and a gradual decrease for the Local Courts (n=3,654 in 1993; n=3,069 in 1998). Despite this downward trend, there has been a significant increase in the proportion of these offences being dealt with in the Local Courts as compared with the District Court (Figure 5).
Figure 5
Percentage of new Table 1 and Table 2 matters dealt with by the Local Courts (19931998)
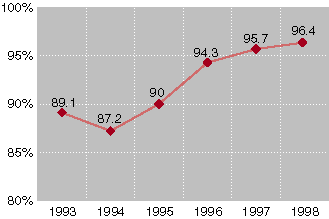
Two classes of offence are incorporated into this sample, each contributing differently to the trends observed. Those offences which have been created since 1995 and inserted into both Tables 1 and 2, and those offences existing prior to 1995, which were newly introduced into both Tables at the commencement of the amendments.
For example, s 23(1) of the Drug Misuse and Trafficking Act 1985 creates the offence of cultivation, supply or possession of a prohibited plant. This offence was inserted into both Tables 1 and 2 at the commencement of the 1995 amendments. Following the amendments, the Judicial Commission’s statistics indicate a shift toward the Local Courts of approximately 7% of the total case load for this offence. Further, the Local Courts appear to be sentencing 99% of all such offenders.
A second example is s 60(1) of the Crimes Act 1900 which appears in both Table 1 and Table 2. This offence was inserted into the Crimes Act in 199723, with assaults upon police officers formerly being dealt with under the general assault provisions in the Act24. Only 112 matters were dealt with in 1998, all heard in the Local Courts, with 15.2% being sentenced to a term of imprisonment. These offences can therefore be viewed as independently contributing to the overall increase in the number of matters being dealt with by the Local Courts.
Figure 6
Penalty Type in the Local Courts for new Table 1 and Table 2 offences (19931998)
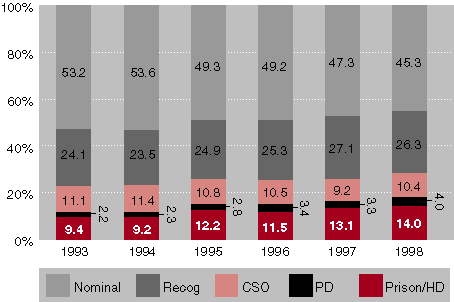
Figure 6 represents the distribution of penalties imposed in the Local Courts for the new Table 1 and Table 2 offences, which appear to have contributed to the overall increase in matters dealt with in the Local Courts. They also appear to have contributed to the general increase in the imposition of custodial penalties in the Local Courts.
What is most notable is the fact that, despite a drop in the actual number of matters being dealt with during the period 1995 (n=3654) to 1998 (n=3069), an increase in the proportion of persons being imprisoned (9.4% in 1993; 14% in 1998) can be observed. During the period of time in which the amendments took effect, 9.2% (n=305) of offenders were sentenced to a term of imprisonment in 1994, increasing to 11.5% (n=411) in 1996. Furthermore, if periodic detention is included in these figures, this increase is from 11.5% (n=381) in 1994 to 14.9% (n=532) in 1996.
Offences Common to Both Tables
Several offences are common to both Table 1 and Table 2, and were common to ss 476 and 496, respectively, of the Crimes Act 1900, prior to the 1995 amendments. The statistics do not distinguish between matters dealt with as a Table 1 or Table 2 offence. However, comparisons are readily drawn because of the fact that the criteria under which the offences were set out, in either the Crimes Act 1900 or the Criminal Procedure Act Tables, have remained unchanged over the period being examined. For this reason, there would be little or no change expected in the sentencing distribution of these offences.
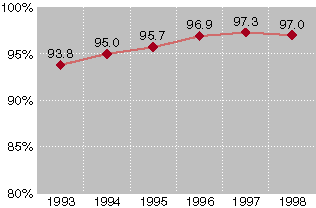
Despite the fact that there was an overall decline in the total numbers of these matters being dealt with in both the District Courts (n=422 in 1993; n=193 in 1998) and Local Courts (n=6,370 in 1993; n=6192 in 1998), Figure 7 indicates a slight shift toward the Local Courts in the distribution of these offences. For the reasons stated above, it is unlikely that such a shift could be directly attributed to the 1995 amendments.
Figure 7
Percentage of matters common to both Tables (and prior equivalent) dealt with by the Local Courts (19931998)
The types of penalty imposed in the Local Courts for these offences appear to have remained relatively constant over the given period (Figure 8). However, whilst there was a small drop in the proportion of Community Service Orders imposed between 1995 (8.2%) and 1996 (7%), there appear to be no significant effects attributable to these types of offences being incorporated into both Tables.
Figure 8
Local Courts: penalty type for matters common to both tables (and prior equivalent) (19931998)
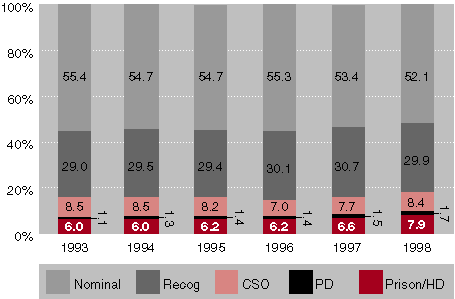
Table 1 Offences – Previously Summary Only With Consent of the Accused
Since the 1995 amendments, whereupon the power to elect the forum was conferred upon the prosecuting authority, a greater proportion of these matters are being sentenced in the Local Courts (Figure 9).
Figure 9
Percentage of Table 1 offences (or equivalent) dealt with in the Local Courts (19931998)25
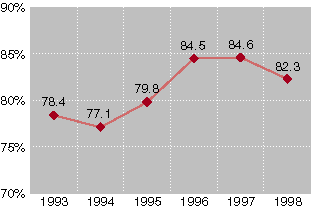
This group of offences most clearly demonstrates the effects of the abrogation of the discretion of Magistrates to remove matters to the District Court. Prior to the 1995 amendments a variety of offences were to be prosecuted by indictment unless either the Magistrate directed that it be otherwise or the accused consented to it being otherwise26.
An increase in the proportion of these offences is observed over the full period. In 1993, the Local Courts dealt with 78.4% (n=3451) of this type of offence, whereas in 1998 this had increased to 82.3% (n=3155) of these offences. The largest shift is to be observed in the period surrounding the 1995 amendments. In 1994, 77.1% (n=3067) of these matters were dealt with at Local Court level, increasing to 84.5% in 1996 (n=3759).
Such changes indicate that the removal of the discretion of Magistrates to refer matters to the District Court has had a direct impact on the distribution of matters between the two courts.
Figure 10
Penalty type for Table 1 matters (or equivalent) dealt with in the Local Courts (19931998)
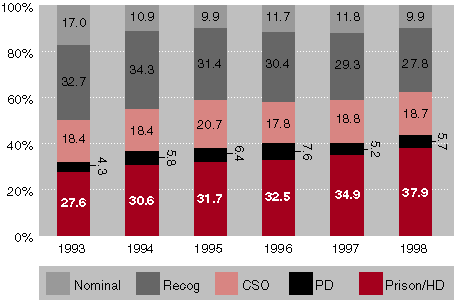
Figure 10 depicts the distribution of penalties imposed for Table 1 (or equivalent) offences at Local Court level. This group of offences generally attracts harsher penalties than any other group and, since the 1995 amendments, the use of imprisonment as a sanction in the Local Courts has increased from 27.6% (n=952) in 1993 to 37.9% (n=1195) in 1998. In the period surrounding the amendments, an increase from 30.6% (n=939) in 1994, to 32.5% (n=1222) in 1996 is observed. Where the figures for periodic detention are included, the increase is markedly larger, with 36.3% (n=1113) receiving such sanctions in 1994, compared with 40.1% (n=1507) in 1996.
Table 2 Offences – Previously Summary Without Consent of the Accused
Figure 11 shows a very small change in the percentage of matters being dealt with by Local Courts. This might be expected, as the responsibility for the election of forum largely remained with the prosecuting authority for these offences27.
Figure 11
Percentage of Table 2 matters (or equivalent) dealt with in the Local Courts (19931998).28
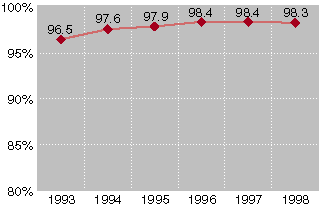
These offences are the less serious offences, assisting to explain the fact that the Local Courts deal with almost all of these matters (96.4% in 1993; 98.3% in 1998). Further, these offences account for the greatest number of Local Court matters being considered, with 11,277 cases being dealt with in 1993, increasing to 12,359 in 1998.
Figure 12
Penalty type for Table 2 matters (or equivalent) dealt with in the Local Courts (19931998)
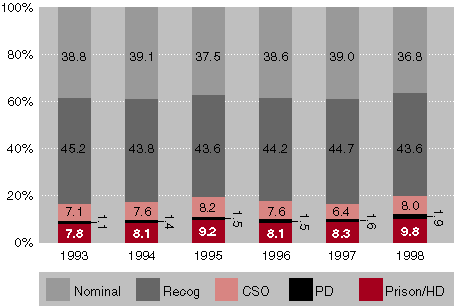
Figure 12 represents the types of penalties being imposed in Local Courts for this class of offence. As might be expected, very little change was observed in the pattern of sentencing for this group of offences. In 1993, 7.8% (n=880) of these offenders were sentenced to imprisonment, which had increased to 9.8% (n=1211) in 1998. For the period spanning the 1995 amendments, only an increase in raw numbers is observed, with 8.1% (n=892) being sentenced to imprisonment in 1994, and 8.1% (n=971) in 1996. If periodic detention is included in these figures, the change observed is only slightly greater, being from 9.5% (n=1046) in 1994 to 9.6% (n=1151) in 1996.
Conclusions
It is obviously not possible to attribute all of the increases solely to the effects of the amendments. Many other factors may be involved, such as changes in policing policies, changes in the crime rate, changes in the reporting of crime and other concomitant legislative changes.
However, the findings from this study can be interpreted as supporting the hypothesis that the Criminal Procedure Amendment (Indictable Offences) Act 1995 has had an effect upon the distribution of offences dealt with in the Local Courts. In particular, during the period encompassing the commencement of the amending legislation (19941996), significant increases in the number and severity of offences sentenced in the Local Courts were recorded.
Endnotes
| * | Officer of the Judicial Commission of New South Wales. |
| 1 | D Weatherburn and MT Nguyen da Huong, “Aspects of Demand for District Court Time” (1992) 15 Crime and Justice Bulletin 1. This study reported that, for each category of offence studied at District Court level, more than 50% of the penalties imposed lay within the sentencing discretion of the Local Courts (at 9). |
| 2 | The Attorney General, the Honourable JW Shaw QC MLC, Second Reading, Legislative Council, Hansard, 24 May 1995, p 119. |
| 3 | Unless otherwise indicated, all references to Acts of Parliament are to those of New South Wales. |
| 4 | On 1 January 2000, Table 1 and Table 2 were transferred to Schedule 1 of the Criminal Procedure Act 1986 by amendments effected by the Crimes Legislation Amendment (Sentencing) Act 1999. |
| 5 | For a more comprehensive discussion of these reforms, see The Honourable Justice Peter Hidden, “Trial by Judge Alone in NSW” (1997) 9(6) Judicial Officers’ Bulletin 41. |
| 6 | Note that ss 476, 495, 496, 496A and 497 remain part of the Crimes Act 1900, although by virtue of s 33(2) of the Criminal Procedure Act 1986 these sections no longer apply where a person is charged after the commencement date of s 33. |
| 7 | Sections 476 and 497 of the Crimes Act 1900 (reprinted as at 2 March1995). Section 18 Criminal Procedure (Indictable Offences) Act 1995; the Honourable JW Shaw QC MLC, op cit note 2, p 119. |
| 8 | The Attorney General, the Honourable JW Shaw QC MLC, Second Reading, Legislative Council, Hansard, 31 May 1995, p 401. |
| 9 | Total criminal matters: n=94,723 in 1998; Table 1 and Table 2 matters: n=24,776 (26.2%) in 1998. |
| 10 | Total criminal matters: n=2,599 in 1998. Table 1 and Table 2 matters: n=1,215 (46.7%) in 1998. |
| 11 | For the purposes of this paper, a matter “dealt with” means that the offender was sentenced in that particular court. |
| 12 | The maximum penalties for Table 1 offences are set out in s 27 of the Criminal Procedure Act 1986. Maximum penalties for Table 2 offences are set out in s 28 of the Criminal Procedure Act 1986. Certain other offences, such as attempt, aiding, abetting, counselling or procuring a misdemeanour, and conspiracy or inciting the commission of an offence, retain the statutory maxima as set out in the relevant legislation, subject to certain exceptions. Section 444 of the Crimes Act 1900, allowing for the concurrent and cumulative structure of sentences, is not affected by either s 27 or s 28. |
| 13 | Section 23(1) of the Drugs Misuse and Trafficking Act 1985. |
| 14 | Sections 562AB and 99 of the Crimes Act 1900, respectively. |
| 15 | Sections 7 and 62_64 of the Firearms Act 1989. |
| 16 | Sections 195, 125 and 178BA Crimes Act 1900, respectively. |
| 17 | Sections 35, 61M and 94 of the Crimes Act 1900, respectively. |
| 18 | Sections 59, 61 and 154A of the Crimes Act 1900, respectively. |
| 19 | Where both full time imprisonment and home detention sentences are taken to be 2 years or less (maximum penalty as set out in s 476 of the Crimes Act 1900 up to 1994 inclusive, and thereafter maximum penalties as set out in Table 1 of the Criminal Procedure Act 1986.) Periodic detention is taken to be between 3 months and 2 years: Periodic Detention of Prisoners Act 1981 prior to the 1999 amendments. Community Services Orders do not exceed 500 hours: Community Service Orders Act 1979. Recognizances are taken to be of any length: Crimes Act 1900. Fines are taken to be $2,000 up to 1991 (s 476 of the Crimes Act 1900), $5,000 up to 1992 (the Statute Law (Penalties) Act 1992 introduction of penalty units), $10,000 up to 1995 (Criminal Procedure Indictable Offences Act 1995 (ss 27 and 28)) and $11,000 from 1997 (Interpretation Act amendments increasing the value of one penalty unit by 10%). |
| 20 | A Bureau of Crime Statistics and Research Media Release, 24 September 1999, indicates that the Local Courts deal with the vast majority of criminal charges laid by police: Bureau of Crime Statistics and Research, Media Release: NSW Criminal Courts Statistics-1998, 24 September 1999. Therefore, a relatively small percentage change accounts for a large increase in the numbers of matters handled. |
| 21 | Ibid. |
| 22 | Including home detention, but not periodic detention. |
| 23 | Crimes Amendment (Assault of Police Officers) Act, Number 80 of 1997. |
| 24 | Explanatory note to the Crimes Amendment (Assault of Police Officers) Act 1997. |
| 25 | These figures do not include those offences that were previously discussed as being newly inserted into either Table 1 or both Tables in 1995. |
| 26 | Section 476 of the Crimes Act 1900, reprinted as at 2 March 1995. |
| 27 | Table 2 offences, as set out in the Criminal Procedure Act 1986. Cf Those offences appearing under ss 496_500 of the Crimes Act 1900, reprinted as at 2 March 1995. |
| 28 | These figures do not include those offences that were previously discussed as being newly inserted into either Table 2 or both Tables in 1995. |
ISSN 1036 4722
Published by the Judicial Commission of New South Wales
| Location: | Level 5, 301 George St, Sydney NSW 2000, Australia |
| Postal address: | GPO Box 3634, Sydney NSW 2001 |
| Telephone: | 02 9299 4421 |
| Fax: | 02 9290 3194 |
| Email: | judcom@judcom.nsw.gov.au |
| Website: | www.judcom.nsw.gov.au |
Disclaimer
This paper was prepared by officers of the Judicial Commission for the information of the Commission and for the information of judicial officers. The views expressed in the report do not necessarily reflect the views of the Judicial Commission itself but only the views of the officers of the Commission who prepared this report for the Commission.


