


Georgia Brignell
Senior Research Officer (Legal), Research and Sentencing
Zeinab Baghizadeh
Research Officer (Statistics), Research and Sentencing
Patrizia Poletti
Research Officer (Statistics), Research and Sentencing
Pauline Buckland
Editor
Introduction
The purpose of this Sentencing Trends & Issues (the Trends) is to report the sentences imposed in the Local Court of NSW (the court) in 2010 and to compare these with the findings reported in previous studies undertaken by the Judicial Commission of NSW for offences dealt with in 2002 and 2007.1 Legislative changes which may have influenced sentencing patterns since the earlier studies are discussed. The Trends presents some general findings about offender profiles, the frequency of statutory, regulatory and common law offences before the court, and their classification under the Australian and New Zealand Standard Offence Classification (ANZSOC).2 It also reports the sentences imposed for the 20 most common proven statutory offences dealt with by the court in 2010. The Trends concludes with a brief discussion of the sentencing patterns for the 10 most common proven regulatory offences dealt with in the court in 2010.
Data source and methodology
Sentencing data for the court are provided by the Bureau of Crime Statistics and Research (BOCSAR) and then processed to generate the statistics which appear on the Judicial Information Research System (JIRS).
The Trends only analyses sentencing data for first instance proven offences in finalised court appearances. The data have not been corrected to take into account the outcomes of subsequent conviction or sentence appeals to the District Court.
The data exclude sentences imposed following breach proceedings,3 but include penalties imposed for contested penalty infringement notices.
Where a person has been sentenced in more than one finalised court appearance during the data period, the data include the sentence imposed in each finalised court appearance.
Where an offender has been sentenced for multiple offences in a single finalised court appearance, the offence which attracts the highest penalty in terms of type and quantum of sentence is selected as the principal offence.4Unless otherwise indicated below, the principal offence is used in the analyses of offences.
Some offences attract a higher maximum penalty where an offender is sentenced for a second or subsequent offence (such as driving offences),5 or where the value of the property exceeds a certain amount (property offences). The Trends does not consider the effect of the presence or absence of a prior record for specific offences, although some aspects of the analyses consider property values.
Terminology
The term median refers to the sentence which lies in the middle of a range of values. The term mean refers to the average value. The term mode is used to indicate the most frequently occurring value or values. The percentages in parentheses following the mode indicate the number of offenders who were given that value for the penalty.
In respect of fines, the percentage of fines which fall within the middle 50% range of values is shown. The lower limit of this range is set at the first quartile (or 25th percentile) and the upper limit is set at the third quartile (or 75th percentile). This range shows the spread of values near the centre.
In respect of custodial sentences, the full term refers to the non-parole period of the sentence and the balance of the term of sentence. The NPP/fixed term refers to the minimum period of time to be served in custody.
The abbreviation pu refers to penalty units,6 and pp refers to percentage points.
General findings
A total of 127,947 offenders7 were sentenced in the court in 2010 for 219,257 offences, whether or not the offence was a principal offence. These offences include statutory (81.0%), regulatory (19.0%) and common law (0.04%) offences. The overwhelming majority of offences were committed contrary to NSW law (97.8%). Only 2.2% were committed contrary to Commonwealth legislation.
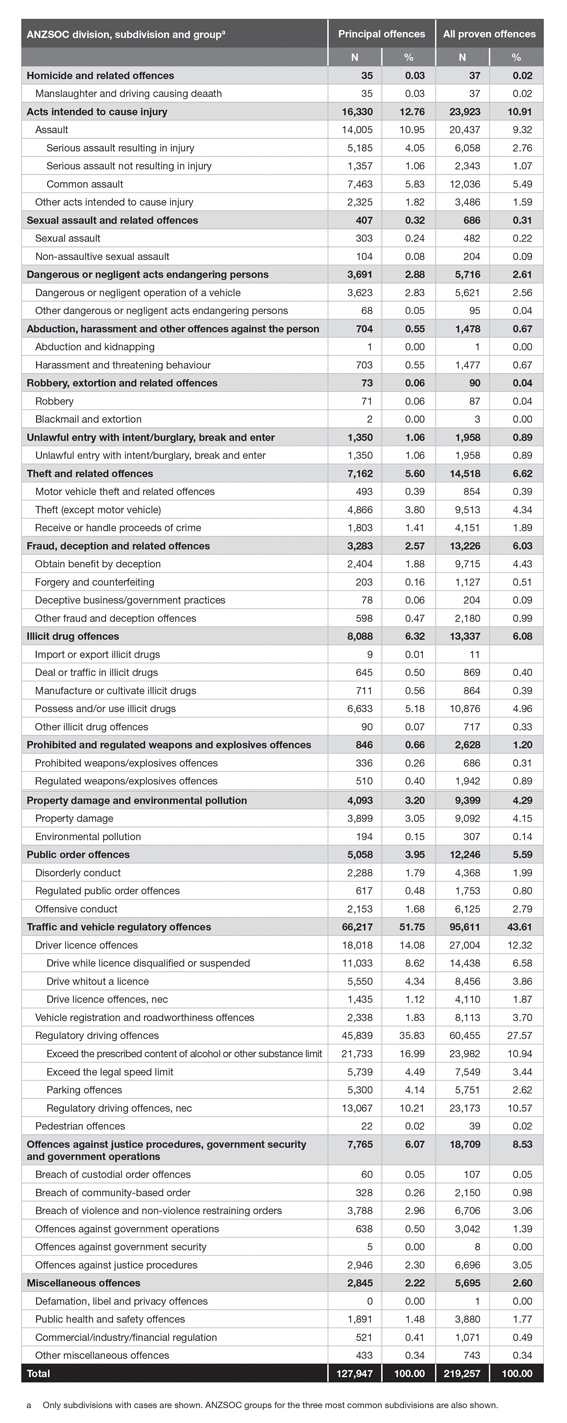
Appendix A shows a breakdown of the 219,257 offences by ANZSOC division and subdivision, and for the most common subdivisions, by ANZSOC group.8 By far the most common offences fell into ANZSOC division traffic and vehicle regulatory offences, accounting for 43.6% (95,611) of all offences. In particular, exceed the prescribed content of alcohol or other substance limit was the most common ANZSOC group, accounting for 10.9% (23,982) of all offences. The next most common offences fell into ANZSOC divisions acts intended to cause injury (23,923 or 10.9%), offences against justice procedures, government security and government operations (18,709 or 8.5%), theft and related offences (14,518 or 6.6%), illicit drug offences (13,337 or 6.1%), and fraud, deception and related offences (13,226 or 6.0%).
Appendix A also shows a breakdown of the 127,947 principal offences by ANZSOC division. The most common principal offences fell into ANZSOC division, traffic and vehicle regulatory offences, accounting for 51.8% (66,217) of all principal offences. In particular, exceed the prescribed content of alcohol or other substance limit (21,733 or 17.0%) and drive while licence disqualified or suspended (11,033 or 8.6%) were the most common ANZSOC groups. The next most common principal offences fell into ANZSOC division acts intended to cause injury (16,330 or 12.8%), with the subdivision assault accounting for 10.9% (14,005) of all principal offences.
Offender characteristics9
Gender: Offenders sentenced in the court were predominantly male (79.7%), while 20.3% were female.10
Age: The median age of offenders at the time of offence was 32 years and the mean age was 34.04 years.11
Indigenous status: Aboriginal and Torres Strait Islander persons accounted for 10.5% of offenders.12
Court location: More than half of the cases were finalised in Sydney (58.9%), 31.0% were finalised in courts located in rural NSW and 10.1% were finalised in courts located in Newcastle or Wollongong.
Number of offences: Just over two-thirds of offenders were sentenced for one offence only (67.5%), while almost one-third were sentenced for multiple offences (32.5%): 17.7% were sentenced for two offences; 7.4% were sentenced for three offences; 3.3% were sentenced for four offences; and 4.1% were sentenced for five or more offences.13
Plea: Approximately three-quarters of offenders (75.5%) pleaded guilty.14
Prior record: Just under half of offenders had no prior record of offending (44.5%), while just over half had a prior record (55.5%): 22.6% had prior offences of a different type and 32.9% had prior offences of the same type.15 Overall, 12.2% of offenders had previously served a term of full-time imprisonment: 5.1% for an offence of the same type and 7.1% for an offence of a different type.16
Bail status at sentencing: Bail was not an issue in the majority of cases (76.4%).17 For the remaining cases, the offender was either on bail (17.4%) or in custody (6.2%)18 at the time of sentencing.19
Jurisdiction of the court
The court has jurisdiction to hear and determine two types of offences summary offences and indictable offences which may be dealt with summarily under Ch 5 of the Criminal Procedure Act 1986.20 Importantly, ss 267 and 268 of that Act, which set out the maximum penalties that can be imposed by the court for particular indictable offences being dealt with this way, prescribe the jurisdictional limit of the Local Court and not the maximum penalty for any offence triable within that jurisdiction.21
Despite the jurisdictional limit of the court, the maximum penalty for an offence remains relevant to the sentencing exercise and the jurisdictional maximum should not be regarded as some form of maximum penalty reserved for a worst case.22 In R v Doan,23 the Court of Criminal Appeal held that a jurisdictional maximum is:
NOT A MAXIMUM PENALTY FOR ANY OFFENCE TRIABLE WITHIN THAT JURISDICTION. IN OTHER WORDS, WHERE THE MAXIMUM APPLICABLE PENALTY IS LOWER BECAUSE THE CHARGE HAS BEEN PROSECUTED WITHIN THE LIMITED SUMMARY JURISDICTION OF THE LOCAL COURT, THAT COURT SHOULD IMPOSE A PENALTY REFLECTING THE OBJECTIVE SERIOUSNESS OF THE OFFENCE, TEMPERED IF APPROPRIATE BY SUBJECTIVE CIRCUMSTANCES, TAKING CARE ONLY NOT TO EXCEED THE MAXIMUM JURISDICTIONAL LIMIT.24
Of the 20 most common statutory offences, the offences of common assault, assault occasioning actual bodily harm, destroy or damage property, larceny, stalk or intimidate with intent to cause fear of physical or mental harm and assault with intent on certain officers are subject to this principle.
Section 58 of the Crimes (Sentencing Procedure) Act 1999 limits consecutive sentences that can be imposed by the court to a maximum total of 5 years, subject to certain exceptions set out in s 58(3).
Penalties for statutory offences
The Crimes (Sentencing Procedure) Act (the Act) sets out the penalties available to the court. Unless otherwise specified, references to sections below are to sections of the Act. The Act divides penalties into custodial sentences and non-custodial sentences. Custodial sentences include full-time imprisonment (ss 5, 4446), periodic detention (PD) (s 6, available until 30 September 2010),25 intensive correction orders (ICOs) (s 7, available from 1 October 2010)26 and home detention (HD) (s 6, renumbered from s 7 on 1 October 2010).27 Non-custodial penalties include suspended sentences (s 12), community service orders (CSOs) (s 8), good behaviour bonds (s 9), dismissals of charges and conditional discharges (s 10), and convictions with no other penalty (s 10A convictions). The term imprisonment includes custodial sentences as well as suspended sentences.
In the Trends, recognizances with or without conviction under either ss 19B or 20 of the Crimes Act 1914 (Cth) are included with the figures for the comparable State provisions.
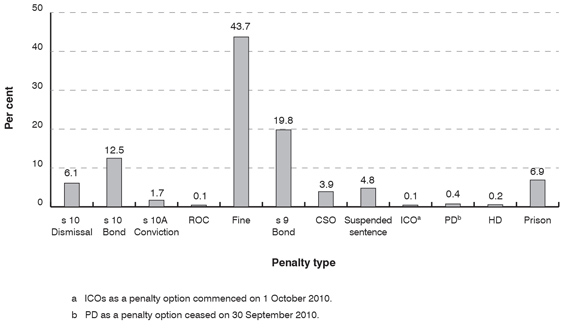
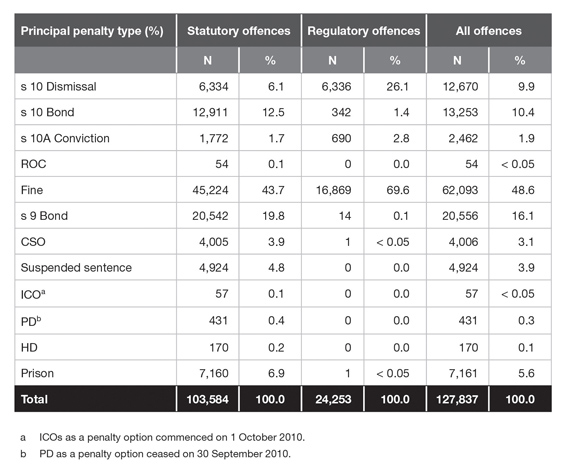
Figure 1 shows the distribution of penalty types for 103,584 offenders sentenced for statutory offences in the court in 2010 (principal offences only).28 The x-axis shows the penalty types in order of severity (from least severe to most severe) and the y-axis shows the frequency with which these penalties were imposed by the court.
Figure 1: Distribution of penalty types for offenders sentenced for statutory offences in the NSW Local Court in 2010 (principal offences only)
The following is a summary of these findings, setting out the penalties imposed (in order of frequency) for all statutory offences (principal offences only). Regulatory offences have been excluded to allow comparisons with findings from 2007 and 2002. Note that Appendix B shows the distribution of penalty types for all principal offences (broken down by statutory and regulatory offences).
Fines were the most common penalty ordered by the court, accounting for 43.7% of all penalties imposed.29 The median fine was $500, an increase from 2007 and 2002 (both $400). The mode was $500 (imposed on 15.4% of offenders who were fined). The middle 50% range of fines was $300 to $700, accounting for 54.1% of fines. The proportion of penalties represented by fines in 2010 was less than in 2007 (48.2%) and 2002 (50.2%). However, fines were still by far the most common penalty imposed by the court.
Good behaviour bonds under s 9 (s 9 bonds) were imposed on 19.8% of offenders.30 In 2007 and 2002, bonds accounted for 18.0% and 14.5% respectively of all penalties imposed, indicating a gradual increase in the use of this penalty option by the court. The median duration of bonds was 12 months (unchanged from the previous studies), and the mode was also 12 months (imposed on 46.4% of offenders given bonds). The vast majority of bonds (86.0%) were in the range of 12 to 24 months. The median duration of bonds for Commonwealth offences (18 months) was longer than for NSW offences (12 months), although shorter than those imposed in 2007 (24 months). Overall, 68.2% of bonds were unsupervised, while supervised bonds were longer than unsupervised bonds (18 months compared with 12 months).
Dismissals and discharges without conviction31 under s 10 were imposed on 18.6% of offenders.32 Of this figure, 6.1% had their charge dismissed unconditionally (s 10 dismissals),33 and 12.5% were conditionally discharged on a good behaviour bond (s 10 bonds).34 The use of s 10 bonds was greater than in 2007 (10.5%) and 2002 (10.4%). Unconditional dismissals accounted for 6.2% of sentences in 2007 and 7.4% in 2002. As was the case in the previous studies, in those cases in which a bond was imposed, the median duration and mode of the bond was 12 months (imposed on 51.7% of these offenders).
Full-time imprisonment was imposed on 6.9% of offenders.35 This figure was very similar to that observed in 2007 (6.5%) and the same as that observed in 2002 (6.9%). The median full term was 9 months, compared with 8 months in 2007 and 6 months in 2002. The median NPP/fixed term was 6 months. Fixed terms of full-time imprisonment were imposed in 44.3% of cases.36 Where a non-parole period was set, the median full term was 12 months and the median non-parole period was 6 months (both unchanged since 2007). Special circumstances37 were found in over three-quarters of the cases where a non-parole period was set (76.4%). The most common ratios (between the non-parole period and the full term) were 1:2 and 2:3 (imposed on 17.1% and 16.5% of these offenders respectively). The Trends does not analyse consecutive sentences or the effect that the limitation in s 58 may have on patterns of sentencing.
Suspended sentences under s 12 were imposed on 4.8% of offenders.38 There has been a gradual increase in the use of this penalty option by the court. In 2007 and 2002, suspended sentences accounted for 4.4% and 4.0% respectively of all penalties imposed. The median term was 9 months (unchanged from the previous studies), and the mode was 12 months (imposed on 26.0% of offenders given suspended sentences). The median term of suspended sentences for Commonwealth offences (13 months) was longer than for NSW offences (9 months). Supervision was imposed in 53.6% of cases. There was no difference in the duration of suspended sentences according to whether supervision was imposed or not.
Community service orders (CSOs) were imposed on 3.9% of offenders.39 There has been a slight decrease in the use of this penalty from 4.2% in 2007 and 4.5% in 2002. The median term of CSOs was 120 hours (up from 100 hours in the previous studies), and the mode was 100 hours (27.6%). CSOs for 150 hours (16.9%) and 200 hours (16.0%) were also common.
Convictions recorded with no other penalty (s 10A convictions) were imposed on 1.7% of offenders. The use of this penalty has increased from 0.8% in 2007. However, the penalty option only became available from 29 November 2006.40
Periodic detention orders (PD) were imposed on 0.4% of offenders.41 This penalty option was only available to the courts for nine months of the year (until 30 September 2010). The median full term was 9 months (compared with 8 months in 2007 and 6 months in 2002) and the median NPP/fixed term was 6 months. Even allowing for its non-availability as a penalty option for the last quarter of 2010, its use had been declining (0.9% in 2007 and 1.2% in 2002).42
Home detention orders (HD) were imposed on 0.2% of offenders.43 The frequency of use of this penalty option was very similar to 2007 (0.2%) and 2002 (0.3%). The median full term was 9 months (unchanged from 2007 but up from 6 months in 2002). The median NPP/fixed term was 6 months.
Intensive correction orders (ICOs) were imposed on only 0.1% of offenders. This new penalty option was only available for three months of the study period (from 1 October 2010).44 The median term of ICOs was 10 months and the mode was 12 months (26.3%).
Rising of the court (ROC) was imposed on 0.1% of offenders, which was unchanged from 2007, but down from 2002 (0.5%).
Twenty most common statutory offences
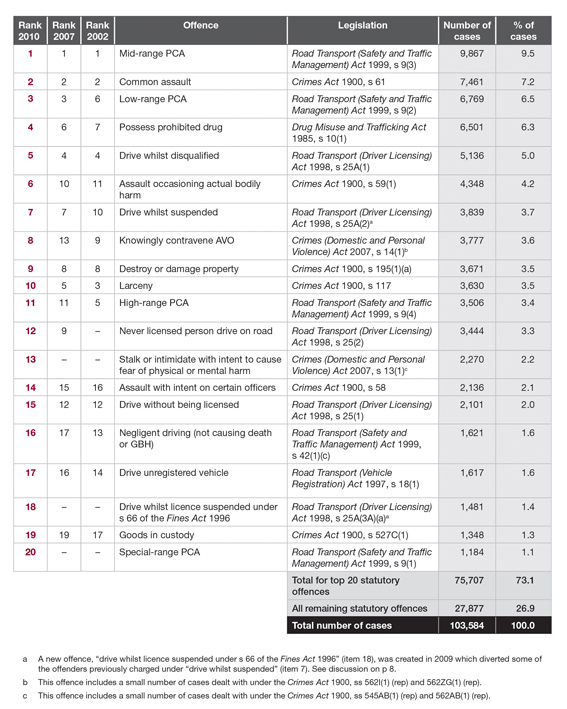
Table 1 shows the 20 most common statutory offences (principal offences only) dealt with by the court in 2010. These accounted for 73.1% of the total number of statutory offences sentenced in that year (75,707 offenders). By comparison, in 2007 the 20 most common statutory offences accounted for 74.7% of the total number of statutory offences sentenced by the court (82,095 offenders).
Table 1: Most common statutory offences (principal offence only) sentenced in the NSW Local Court in 2010
Distribution of the most common offences
The distribution of the 20 most common statutory offences resembled those for 2007 and 2002. Seventeen of the offences appearing in the 2010 list appeared in the 2007 list, and 16 also appeared in the 2002 list. However, the following three new offences appeared in the list for 2010 (with their 2010 rankings in parentheses):
- (13) Stalk or intimidate with intent to cause fear of physical or mental harm: Crimes (Domestic and Personal Violence) Act 2007, s 13(1)45
- (18) Drive whilst licence suspended under s 66 of the Fines Act 1996: Road Transport (Driver Licensing) Act 1998, s 25A(3A)(a)
- (20) Special-range PCA:46 Road Transport (Safety and Traffic Management) Act 1999, s 9(1).
The three offences appearing in the 2007 list which did not appear in the 2010 list were (with their 2007 rankings in parentheses):
- (14) Offensive conduct: Summary Offences Act 1988, s 4
- (18) Offensive language: Summary Offences Act 1988, s 4A
- (20) Drive recklessly/furiously or dangerous speed/manner: Road Transport (Safety and Traffic Management) Act 1999, s 42(2).
In all three years (2002, 2007 and 2010), mid-range PCA and common assault held the same rank (first and second respectively) in the 20 most common statutory offences list. Four of the five most common statutory offences in 2010 were in the top five for 2007 (three for 2002). Six of the offences appearing in the 2010 list held the same position as they held in 2007 (two for 2002).
Offences relating to the use and operation of a motor vehicle continued to dominate the list as was the case in 2002 and 2007. The offence under s 25A(3A)(a) of drive whilst licence suspended under s 66 of the Fines Act 1996 did not appear in the 2007 study as it was inserted into s 25A of the Road Transport (Driver Licensing) Act 1998 at the end of 2008, and commenced on 9 March 2009.47 Prior to the introduction of this offence, the offence of drive whilst suspended under s 25A(2) included licence suspension for both unsafe driving and fine default. The new offence was created to distinguish between the two groups of offenders and allow courts to impose sanctions reflecting the lower threat to the community posed by those who lost their licence through a fine default compared with those who lost their licence due to unsafe driving.48
The number of offenders sentenced for the offence of drive whilst suspended has increased since 2002, where it was ranked 10th (representing 3.1% of cases), to rank seventh in 2007 (representing 4.2% of cases) and 2010 (representing 3.7% of cases). The gradual rise observed from 2002 to 2007 may well have continued in 2010 had some of these offenders not been diverted to the new offence of drive whilst suspended under s 66 of the Fines Act 1996. The change effected by introducing the new offence may also explain the noticeable reduction (17.8%) in the number of cases for the offence of drive whilst suspended between 2007 and 2010.
The Criminal Procedure Further Amendment (Penalty Notices) Regulation 2007 provided that the previous trial scheme of criminal infringement notices (CINs) for a number of offences, including stealing (where the value of property stolen was less than $300), offensive language, offensive behaviour and goods in custody, operate for all of NSW.49 It enabled police officers to issue on-the-spot fines for these offences where previously offenders had been taken to the police station to be charged. The introduction of CINs may explain why the offences of offensive behaviour and offensive language were no longer in the list of the 20 most common statutory offences in 2010. It may also explain why there was a 30.4% decrease in the number of offenders sentenced for larceny and why larceny fell from fifth in 2007 (representing 4.7% of cases) to 10th in 2010 (representing 3.5% of cases).
There was a 32.1% increase in the number of offenders sentenced for possess prohibited drug. This offence moved up the list from sixth ranking in 2007 (representing 4.5% of cases) to fourth in 2010 (representing 6.3% of cases). The number of offenders sentenced for knowingly contravene AVO also increased by 23.2%, with the offence moving up from 13th ranking in 2007 (representing 2.8% of cases) to eighth in 2010 (representing 3.6% of cases).
Penalties for the 20 most common statutory offences
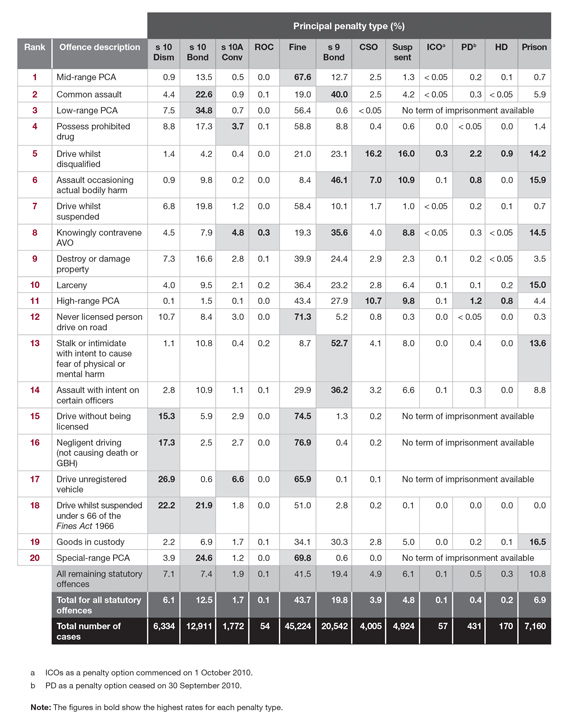
Table 2 shows the penalty distribution for the 20 most common statutory offences (principal offences only) in 2010. The sentencing patterns for these offences are analysed below. Many factors are taken into account when sentencing an offender, including his or her prior record, the number of offences and the plea. The following penalty information does not differentiate between these factors. The offences are listed according to their rankings in Table 1. The penalties imposed within each offence are listed in order of the most frequently imposed to the least.50
Table 2: Distribution of penalty types for the most common statutory offences (principal offence only) in the NSW Local Court in 2010
1. Mid-range PCA
Road Transport (Safety and Traffic Management) Act 1999, s 9(3).
Maximum penalty: 9 mths and/or 20 pu (first offence) [automatic licence disqualification 12 mths,51 12 mths and/or 30 pu (second or subsequent offence) [automatic licence disqualification 3 yrs, minimum 12 mths].
Sentences
- fines (67.6%): the median fine was $700, common fines were $600 (13.4%), $800 (13.1%) and $500 (11.7%); 55.2% of fines were in the middle 50% range of $500$800
- s 10 bonds (13.5%): the median duration was 12 months
- s 9 bonds (12.7%): 29.6% were supervised; the median duration was 12 months
- CSOs (2.5%): the median term was 120 hours
- suspended sentences (1.3%): 50.4% were supervised; the median term was 8 months
- s 10 dismissals (0.9%), full-time imprisonment (0.7%), s 10A convictions (0.5%), PD (0.2%), HD (0.1%) and ICOs (0.02%).
The distribution of penalties for this offence was very similar to that reported in 2007. The offence had the fifth highest rate of fines in the list. The use of fines has increased by 3.9 pp since 2007. Much of this increase was offset by a decrease in the use of s 10 orders (3.0 pp), although CSOs and custodial sentences also decreased (0.6 pp for each). The median fine was unchanged from 2007, but has increased from $600 in 2002. The median term of full-time imprisonment was unchanged from the previous studies (6 months).
Licence disqualification
The vast majority of offenders (85.6%) were disqualified from holding a drivers licence. As the use of s 10 orders has gradually decreased, a gradual increase in disqualifications has been observed from 73.3% in 2002, 82.6% in 2007 to 85.6% in 2010, with a noticeable increase of 12.3 pp since 2002. In 2010, the median period of disqualification was 7 months and the mode was 6 months (46.6%).52 The next most common period of disqualification was 12 months (21.3%). The median period of disqualification was the same as that reported in 2002, but down from 8 months in 2007.
2. Common assault
Crimes Act 1900, s 61.
Maximum penalty: 2 yrs.
Jurisdictional maximum in Local Court: 12 mths and/or 20 pu.53
Sentences
- s 9 bonds (40.0%): 34.0% were supervised; the median duration was 12 months
- s 10 bonds (22.6%): the median duration was 12 months
- fines (19.0%): the median fine was $500, the mode was also $500 (20.9%); 51.3% of fines were in the middle 50% range of $350$700
- full-time imprisonment (5.9%): the median full term was 6 months and the median NPP/fixed term was 4 months
- s 10 dismissals (4.4%)
- suspended sentences (4.2%): 64.2% were supervised; the median term was 8 months
- CSOs (2.5%): the median term was 100 hours
- s 10A convictions (0.9%), PD (0.3%), ROC (0.1%), HD (0.01%) and ICOs (0.01%).
This offence had the third highest rate of s 9 bonds and s 10 bonds in the list, the latter increasing by 5.1 pp since 2007. This increase has mainly been at the expense of penalties at the higher end of the sentencing hierarchy, especially full-time imprisonment (down 1.3 pp), s 12 suspended sentences (down 1.2 pp), and CSOs (down 0.9 pp). The median term of full-time imprisonment and the median fine were unchanged from 2007.
3. Low-range PCA
Road Transport (Safety and Traffic Management) Act 1999, s 9(2).
Maximum penalty: 10 pu (first offence) [automatic licence disqualification 6 mths, minimum 3 mths]; 20 pu (second or subsequent offence) [automatic licence disqualification 12 mths, minimum 6 mths].
Sentences
- fines (56.4%): the median fine was $450, common fine amounts were $500 (20.4%) and $400 (17.1%); 63.9% of fines were in the middle 50% range of $300$550
- s 10 bonds (34.8%): the median duration was 12 months
- s 10 dismissals (7.5%), s 10A convictions (0.7%), s 9 bonds (0.6%) and CSOs (0.02%).
The distribution of penalties for this offence was very similar to that observed in 2007 and 2002. This offence had the highest rate of s 10 bonds in the list, as it did in 2007 (32.5%) and 2002 (31.0%).
Licence disqualification
More than half of offenders (57.7%) were disqualified from holding a drivers licence, which represented a decrease of 2.7 pp since 2007. The median and mode periods of disqualification were both 3 months (54.1%).54 The next most common period of disqualification was 6 months (23.4%). The median period of disqualification was the same as that reported in 2002, but down from 4 months in 2007.
4. Possess prohibited drug
Drug Misuse and Trafficking Act 1985, s 10(1).
Maximum penalty: 2 yrs and/or 20 pu.
Sentences
- fines (58.8%): the median fine was $300, common fines were $200 (17.1%), $300 (15.2%); 69.5% of fines were in the middle 50% range of $200$500
- s 10 bonds (17.3%): the median duration was 12 months
- s 10 dismissals (8.8%)
- s 9 bonds (8.8%): 41.7% were supervised; the median duration was 12 months
- s 10A convictions (3.7%)
- full-time imprisonment (1.4%): the median full term and NPP/fixed term were both 2 months
- suspended sentences (0.6%), CSOs (0.4%), ROC (0.1%) and PD (0.02%).
Penalties for this offence were more lenient in 2010 compared with 2007. Since 2007, the proportion of offenders receiving a fine, s 9 bonds and full-time imprisonment decreased by 8.0 pp, 2.8 pp and 1.1 pp respectively. There were corresponding increases of 7.5 pp for s 10 bonds, 3.3 pp for s 10 dismissals, and 2.1 pp for s 10A convictions. This offence recorded the third highest rate of s 10A convictions in the list. Further, the offence had the shortest median full term (unchanged from 2007) and NPP/fixed term of full-time imprisonment in the list.
Drug type
Cannabis was the type of drug possessed in the majority of cases (56.0%), followed by ecstasy (17.3%), amphetamines (13.8%), heroin (5.9%) and cocaine (5.0%). The remaining 1.9% of possession offences involved other types of drugs.55
Fines were imposed more often for offenders who were in possession of cannabis (70.5%), compared with heroin (58.8%), amphetamines (55.3%), cocaine (38.7%) and ecstasy (30.7%). Possession of heroin was more likely to attract full-time imprisonment or a s 9 bond than any other drug type (6.1% and 17.2% respectively). On the other hand, possession of ecstasy, and to a lesser extent cocaine, attracted the highest rates of s 10 bonds (44.5% and 40.9% respectively) and s 10 dismissals (20.0% and 12.1% respectively). For offenders sentenced to full-time imprisonment, possession of heroin and amphetamines attracted the longest median full term and NPP/fixed term (both 3 months), while possession of cannabis attracted the shortest median full term and NPP/fixed term (both 1 month). For those fined, possession of amphetamines, cocaine and ecstasy attracted the highest median fine ($350), while possession of cannabis attracted the lowest median fine ($250).
5. Drive whilst disqualified
Road Transport (Driver Licensing) Act 1998, s 25A(1).
Maximum penalty: 18 mths and/or 30 pu (first offence) [automatic licence disqualification 12 mths]; 2 yrs and/or 50 pu (second or subsequent offence) [automatic licence disqualification 2 yrs].
Sentences
- s 9 bonds (23.1%): 19.0% were supervised; the median duration was 18 months
- fines (21.0%): the median fine was $750; the mode was $1,000 (18.3%); 62.8% of fines were in the middle 50% range of $500$1,000
- CSOs (16.2%): the median term was 100 hours
- suspended sentences (16.0%): 33.3% were supervised; the median term was 9 months
- full-time imprisonment (14.2%): the median full term was 9 months and the median NPP/fixed term was 6 months
- s 10 bonds (4.2%): the median duration was 15.5 months
- PD (2.2%): the median full term was 9 months and the median NPP/fixed term was 6 months
- s 10 dismissals (1.4%), HD (0.9%), s 10A convictions (0.4%) and ICOs (0.3%).
This offence continued to have an unusually high rate of custodial sentences relative to other driving offences in the list, despite having the same maximum penalty.56 It had the highest rate of custodial sentences (17.6%) of any offence in the list, as was the case in 2007. The proportion of offenders given a custodial sentence was less than that observed in 2007 and 2002 (4.8 pp and 9.4 pp less respectively). The offence had the highest rates in the list for five penalty types: CSOs, suspended sentences, PD, HD and ICOs. It also had the fifth highest rate of full-time imprisonment, with the same median full term as in 2007.
Licence disqualification
The vast majority of offenders (94.4%) were disqualified from holding a drivers licence. This offence had the second highest rate of disqualification in the list. The median and mode periods of disqualification were both 2 years (80.4%).57 The next most common period of disqualification was 12 months (15.1%). These figures were similar to those observed in 2007 and 2002.
6. Assault occasioning actual bodily harm
Crimes Act 1900, s 59(1).
Maximum penalty: 5 yrs.
Jurisdictional maximum in Local Court: 2 yrs and/or 50 pu.
Sentences
- s 9 bonds (46.1%): 35.3% were supervised; the median duration was 15 months
- full-time imprisonment (15.9%): the median full term was 12 months and the median NPP/fixed term was 6 months
- suspended sentences (10.9%): 69.5% were supervised; the median term was 10 months
- s 10 bonds (9.8%): the median duration was
12 months - fines (8.4%): the median fine was $700 and the mode was $500 (18.0%); 67.8% of fines were in the middle 50% range of $500$1000
- CSOs (7.0%): the median term was 150 hours
- s 10 dismissals (0.9%), PD (0.8%), s 10A convictions (0.2%) and ICOs (0.1%).
This offence attracted the second highest rate of full-time imprisonment and the lowest rate of fines of any offence in the list. It also had the second highest rate of suspended sentences and s 9 bonds and the third highest rate of CSOs and PD. It also had the longest median term of full-time imprisonment in the list. While the use of particular penalties fluctuated slightly, the distribution of penalties was similar to that observed in 2007.
The distribution of penalties for this offence substantially mirrors the distribution of penalties for the offence of stalk or intimidate with intent to cause fear of physical or mental harm, a new offence in the list (see Item 13 below). However, the penalty lengths were higher for the offence, assault occasioning actual bodily harm.
7. Drive whilst suspended
Road Transport (Driver Licensing) Act 1998, s 25A(2).
Maximum penalty: 18 mths and/or 30 pu (first offence) [automatic licence disqualification 12 mths]; 2 yrs and/or 50 pu (second or subsequent offence) [automatic licence disqualification 2 yrs].
Sentences
- fines (58.4%): the median fine was $500; the mode was also $500 (21.5%); 51.7% of fines were in the middle 50% range of $400$600
- s 10 bonds (19.8%): the median duration was 12 months
- s 9 bonds (10.1%): 12.9% were supervised; the median duration was 12 months
- s 10 dismissals (6.8%)
- CSOs (1.7%); the median term was 100 hours
- s 10A convictions (1.2%)
- suspended sentences (1.0%): 38.5% were supervised; the median term was 9 months
- full-time imprisonment (0.7%), PD (0.2%), HD (0.1%) and ICOs (0.03%).
As a consequence of the diversion of less serious offenders from this offence to the offence of drive whilst suspended under s 66 of the Fines Act 1996,58 it would not be surprising to find that penalties have become more severe than in previous studies. While little difference was observed in the types of penalties imposed in 2007 and 2002, the terms were slightly longer in 2010.
As expected, sentencing patterns for this offence were more severe than for the new offence even though it has the same maximum penalty.59
Licence disqualification
Almost three-quarters of offenders (73.4%) were disqualified from holding a drivers licence. The median and mode periods of disqualification were both 12 months (76.9%).60 The next most common period of disqualification was 2 years (14.8%). These figures were similar to those observed in 2007.
8. Knowingly contravene AVO
Crimes (Domestic and Personal Violence) Act 2007, s 14(1).61
Maximum penalty: 2 yrs and/or 50 pu.
Sentences
- s 9 bonds (35.6%): 39.1% were supervised; the median duration was 12 months
- fines (19.3%): the median fine was $400; common fines were $500 (18.5%), $200 and $300 (both 15.8%); 73.1% of fines were in the middle 50% range of $200$500
- full-time imprisonment (14.5%): the median full term was 6 months and the median NPP/fixed term was 3 months
- suspended sentences (8.8%): 59.2% were supervised; the median term was 8 months
- s 10 bonds (7.9%): the median duration was
12 months - s 10A convictions (4.8%)
- s 10 dismissals (4.5%)
- CSOs (4.0%): the median term was 100 hours
- ROC (0.3%), PD (0.3%), HD (0.03%) and ICOs (0.03%).
Subsection 14(4) of the Crimes (Domestic and Personal Violence) Act 2007 provides that unless the court otherwise orders, a person who is convicted of an offence under this section must be sentenced to a term of imprisonment if the act constituting the offence was an act of violence against a person.
A term of imprisonment was imposed on 23.7% of offenders. Most terms of imprisonment were full-time (14.5%, the fourth highest rate in the list), however 8.8% were suspended sentences (also the fourth highest rate in the list). While the proportion of offenders receiving a term of imprisonment was 2.1 pp higher than 2002, it has decreased by 4.4 pp since 2007. Whether this fall was due to fewer offences involving an act of violence or to some other factor(s) cannot be established from the data.
This decrease has been offset by increases in the use of s 10A convictions, s 9 bonds, and s 10 bonds (3.0, 2.1, and 1.6 pp respectively). This offence recorded the second highest rate of s 10A convictions and the fifth highest rate of s 9 bonds in the list. The use of fines was relatively low compared with other offences in the list, with this offence having the fourth lowest rate of fines.
While the median term of full-time imprisonment was higher than 2002 (4.5 months), it was unchanged from 2007 (6 months). The median fine was higher than the 2002 and 2007 studies (both $300).
9. Destroy or damage property62
Crimes Act 1900, s 195(1)(a).
Maximum penalty: 5 yrs.
Jurisdictional maximum in Local Court: 12 mths and/or 20 pu (property value does not exceed $2,000);63 12 mths and/or 50 pu (property value does not exceed $5,000);64 2 yrs or 100 pu (property value exceeds $5,000).
Sentences
- fines (39.9%): the median fine was $400, common fines were $500 (17.7%), $400 (15.2%) and $300 (14.9%); 58.0% of fines were in the middle 50% range of $250$500
- s 9 bonds (24.4%): 38.9% were supervised; the median duration was 12 months
- s 10 bonds (16.6%): the median duration was 12 months
- s 10 dismissals (7.3%)
- full-time imprisonment (3.5%): the median full term and NPP/fixed term were both 3 months
- CSOs (2.9%): the median term was 100 hours
- s 10A convictions (2.8%)
- suspended sentences (2.3%): 66.3% were supervised; the median term was 7 months
- PD (0.2%), ROC (0.1%), ICOs (0.1%) and HD (0.02%).
Sentencing patterns for this offence indicate that the court imposed more lenient sentences in 2010 compared with 2007, with rates of full-time imprisonment and s 9 bonds falling 1.4 pp and 3.1 pp respectively. Conversely, the use of penalties at the lower end of the sentencing hierarchy increased, with s 10 bonds increasing by 3.0 pp and s 10A convictions increasing by 1.7 pp. The median fine was unchanged from 2007, but has increased from $300 in 2002. The median term of full-time imprisonment was unchanged from the previous studies.
Property value
Most offences (93.1%) involved property worth up to $2,000,65 with sentences for this group closely resembling the overall patterns for this offence. Offences in the middle band (property from $2,001 to $5,000) and the upper band (property worth more than $5,000) accounted for 5.2%, and 1.7% of cases respectively.
Figure 2 shows the distribution of penalty types for destroy or damage property offences according to the value of property.
Figure 2: Distribution of penalty types for destroy or damage property offences in the NSW Local Court in 2010 according to the value of property
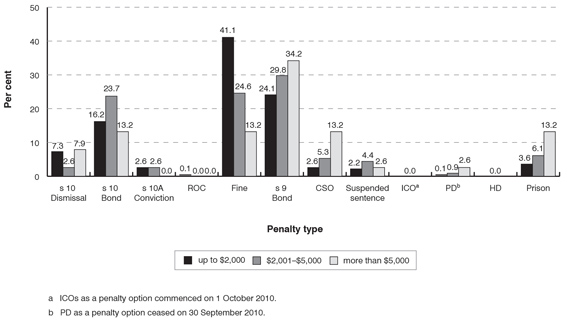
Although the number of cases in the upper band was small, these offenders received more severe penalties, with 15.8% receiving a custodial sentence compared with 7.0% of offenders falling in the middle band and 3.7% of offenders falling in the lower band. This pattern was observed particularly for full-time imprisonment: 13.2% compared with 6.1% and 3.6% respectively. These offenders also received much higher rates of CSOs (13.2% compared with 5.3% and 2.6% respectively). Conversely, fines were imposed less frequently (13.2% compared with 24.6% and 41.1% respectively).
Terms of full-time imprisonment were also more severe where the property involved was of greater value. Offences in the upper, middle and lower bands attracted a median full term of 9 months, 6 months and 3 months respectively, and a median NPP/fixed term of 5 months, 3 months and 3 months respectively.
10. Larceny
Crimes Act 1900, s 117.
Maximum penalty: 5 yrs.
Jurisdictional maximum in Local Court: 12 mths and/or 20 pu (property value does not exceed $2,000);66 12 mths and/or 50 pu (property value does not exceed $5,000);67 2 yrs or 100 pu (property value exceeds $5,000).
Sentences
fines (36.4%): the median fine was $400; the mode was $500 (18.5%); 69.6% of fines were in the middle 50% range of $200$500
- s 9 bonds (23.2%): 42.9% were supervised; the median duration was 12 months
- full-time imprisonment (15.0%): the median full term was 6 months and the median NPP/fixed term was 4 months
- s 10 bonds (9.5%): the median duration was
12 months - suspended sentences (6.4%): 60.3% were supervised; the median term was 8 months
- s 10 dismissals (4.0%)
- CSOs (2.8%): the median term was 100 hours
- s 10A convictions (2.1%)
- ROC (0.2%), HD (0.2%), PD (0.1%) and ICOs (0.1%).
This offence had the highest representation of females (39.7%) of any offence in the list. It was the third most common offence for females, while it was the 12th most common offence for males. It also had the third highest rate of full-time imprisonment in the list.
As expected, due to the introduction of CINs,68 sentencing patterns for larceny in 2010 were more severe when compared with those observed in 2007 and 2002. There was an increase in full-time imprisonment (up 3.1 pp and 4.4 pp respectively) and s 9 bonds (up 3.0 pp and 7.1 pp respectively), and a corresponding decrease in fines (down 3.4 pp and 6.7 pp respectively), s 10 dismissals (down 3.2 pp and 3.7 pp respectively), and s 10 bonds (down 2.6 pp and 2.0 pp respectively).
The median fine has increased from the previous studies (both $300), while the median term of full-time imprisonment was unchanged from 2007, but has increased from 4 months in 2002.
Property value
Most offences (94.4%) involved property worth up to $2,000,69 with only 3.7% of cases falling in the middle band (property from $2,001 to $5,000) and 1.9% of cases falling in the upper band (property worth more than $5,000). The statistics indicate a gradual increase in the severity of penalties where the property value increased.
Figure 3 shows the distribution of penalty types for larceny offences according to the value of property stolen.
Figure 3: Distribution of penalty types for laceny offences in the NSW Local Court in 2010 according to the value of the property
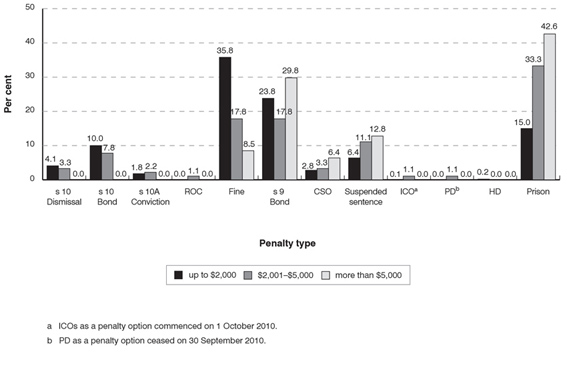
The rates for full-time imprisonment were 42.6%, 33.3% and 15% for the upper, middle and lower bands respectively, while fines were imposed in 8.5%, 17.8% and 35.8% of cases in those bands. The upper band offences also attracted higher rates for other penalties at the higher end of the sentencing hierarchy, such as suspended sentences (12.8% compared with 11.1% and 6.4% respectively) and CSOs (6.4% compared with 3.3% and 2.8% respectively). Conversely, no offender in the upper band received a s 10 order or a s 10A conviction.
Outcomes within penalty types were also more severe where the property involved was of greater value. The upper band offences attracted a median fine of $900 and a median term of full-time imprisonment of 12 months, while the middle band offences attracted a median fine of $500 and median term of full-time imprisonment of 9 months. The lower band offences attracted a median fine of $400 and a median term of full-time imprisonment of 6 months. The median NPP/fixed terms of full-time imprisonment were 7 months, 6 months and 3.5 months respectively.
Shoplifting and other larceny
Well over half of the offences (60.9%) involved shoplifting and 39.1% involved other forms of larceny. Females were further overrepresented in shoplifting offences, committing almost half of these offences (47.5%). On the other hand, females accounted for 27.4% of offenders who committed other forms of larceny. Since the value of property involved in the vast majority of shoplifting offences fell in the lower band, the sentencing patterns for shoplifting were very similar to those of the lower band described above.
11. High-range PCA
Road Transport (Safety and Traffic Management) Act 1999, s 9(4).
Maximum penalty: 18 mths and/or 30 pu (first offence) [automatic licence disqualification 3 yrs, minimum 12 mths]; 2 yrs and/or 50 pu (second or subsequent offence) [automatic licence disqualification 5 yrs, minimum 2 yrs].
Sentences
- fines (43.4%): the median fine was $1000; the mode was also $1000 (20.3%); 54.3% of fines were in the middle 50% range of $750$1300
- s 9 bonds (27.9%): 28.1% were supervised; the median duration was 18 months
- CSOs (10.7%): the median term was 150 hours
- suspended sentences (9.8%): 56.3% were supervised; the median term was 9 months
- full-time imprisonment (4.4%): the median full term was 9.5 months and the median NPP/fixed term was 6 months
- s 10 bonds (1.5%): the median duration was 18 months
- PD (1.2%): the median full term was 9 months and the median NPP/fixed term was 6 months
- HD (0.8%), s 10 dismissals (0.1%), s 10A convictions (0.1%) and ICOs (0.1%).
This offence attracted the second highest rate of PD and HD and the third highest rate of suspended sentences in the list. Conversely, it had the lowest rate of s 10 dismissals and the second lowest rate of s 10 bonds.
The distribution of penalties for this offence was similar to that observed in 2007.70 There was a slight decrease of 1.7 pp in the rate of custodial sentences for this offence compared with 2007, while the use of fines has increased by 3.0 pp since 2007. The median fine was unchanged from 2007, while the median term of full-time imprisonment was only slightly shorter (down from 10 months).
Licence disqualification
The vast majority of offenders (98.4%) were disqualified from holding a drivers licence. This was the highest rate of licence disqualification in the list. The median period of disqualification was 2 years and the mode was 12 months (28.3%).71 These figures were unchanged from 2007.
12. Never licensed person drive on road
Road Transport (Driver Licensing) Act 1998, s 25(2).
Maximum penalty: 20 pu (first offence); 18 mths and/or 30 pu (second or subsequent offence) [automatic licence disqualification 3 yrs].
Sentences
- fines (71.3%): the median fine was $400; the mode was $500 (17.4%); 52.1% of fines were in the middle 50% range of $250$500
- s 10 dismissals (10.7%)
- s 10 bonds (8.4%): the median duration was 12 months
- s 9 bonds (5.2%): 14.5% were supervised; the median duration was 12 months
- s 10A convictions (3.0%)
- CSOs (0.8%), suspended sentences (0.3%), full-time imprisonment (0.3%) and PD (0.03%).
This offence had the third highest rate of fines in the list. Penalties for this offence were more lenient in 2010 compared with 2007. Since 2007, the proportion of offenders receiving s 10 dismissals, s 10 bonds and s 10A convictions has increased by 3.5 pp, 2.9 pp and 2.2 pp respectively. Much of this increase has been offset by a decrease in the use of fines (6.0 pp) and s 9 bonds (1.6 pp). The median fine remained the same.
Licence disqualification
Around 3 in 10 offenders (30.5%) were disqualified from holding a drivers licence. There has been a considerable decrease of 10.3 pp from the 2007 figures and this is mostly explained by the increase in the use of s 10 dismissals and s 10 bonds, although automatic disqualification only applies to second or subsequent offences. The median disqualification period and the mode (78.8%) were equal to the automatic disqualification period of 3 years (unchanged from 2007).
13. Stalk or intimidate with intent to cause fear of physical or mental harm
Crimes (Domestic and Personal Violence) Act 2007, s 13(1).72
Maximum penalty: 5 yrs and/or 50 pu.
Jurisdictional maximum in Local Court: 2 yrs and/or 50 pu.
Sentences
- s 9 bonds (52.7%): 34.8% were supervised; the median duration was 12 months
- full-time imprisonment (13.6%): the median full term was 8 months and the median NPP/fixed term was 4 months
- s 10 bonds (10.8%): the median duration was 12 months
- fines (8.7%): the median fine was $500; the mode was also $500 (31.0%); 54.3% of fines were in the middle 50% range of $400$600
- suspended sentences (8.0%): 65.2% were supervised; the median term was 9 months
- CSOs (4.1%); the median term was 100 hours
- s 10 dismissals (1.1%)
- PD (0.4%), s 10A convictions (0.4%) and ROC (0.2%).
This offence had the highest rate of s 9 bonds in the list. Similar to other offences against the person such as assault occasioning actual bodily harm and knowingly contravene AVO, this offence also had a high rate of full-time imprisonment. Terms of full-time imprisonment were, however, shorter than for assault occasioning actual bodily harm but longer than for knowingly contravene AVO. No comparisons can be made with 2002 and 2007 as the offence did not appear in the 20 most common statutory offences list for those years.
14. Assault with intent on certain officers
Crimes Act 1900, s 58.
Maximum penalty: 5 yrs.
Jurisdictional maximum in Local Court: 2 yrs and/or 50 pu.
Sentences
- s 9 bonds (36.2%): 33.0% were supervised; the median duration was 12 months
- fines (29.9%): the median fine was $450; the mode was $500 (22.7%); 60.5% of fines were in the middle 50% range of $300$600
- s 10 bonds (10.9%): the median duration was 12 months
- full-time imprisonment (8.8%): the median full term was 6 months and the median NPP/fixed term was 4 months
- suspended sentences (6.6%): 62.9% were supervised; the median term was 9 months
- CSOs (3.2%): the median term was 100 hours
- s 10 dismissals (2.8%), s 10A convictions (1.1%), PD (0.3%), ICOs (0.1%) and ROC (0.1%).
This offence had the fourth highest rate of s 9 bonds in the list. The sentencing patterns for this offence closely mirror those observed in 2007.
There has been a gradual increase in the median term of full-time imprisonment for this offence from the previous studies (up from 5 months in 2007 and 4 months in 2002). The median fine has also increased slightly (up from $400 in both of the previous studies).
Assault officer and resist or wilfully obstruct officer
Of those sentenced for this offence, 52.3% assaulted an officer in the execution of his or her duty and 47.7% resisted or wilfully obstructed an officer in the execution of his or her duty.
Figure 4 shows the distribution of penalty types for these offences. The sentencing patterns between these two groups of offenders were very different. As Figure 4 shows, offenders who assaulted an officer received more severe penalties than those offenders who resisted or obstructed an officer, including higher rates of s 9 bonds (42.1%), full-time imprisonment (13.0%), suspended sentences (10.6%) and CSOs (5.0%) compared with offenders sentenced for resisting or obstructing an officer (29.7%, 4.2%, 2.2%, and 1.3% respectively). On the other hand, offenders who resisted or obstructed an officer received higher rates of fines (43.9%), s 10 bonds (13.2%) and s 10 dismissals (3.5%) compared with offenders sentenced for assaulting an officer (17.1%, 8.8% and 2.1% respectively).
Figure 4: Distribution of penalty types for assault and resist/obstruct officer in execution of duty offences in the NSW Local Court in 2010
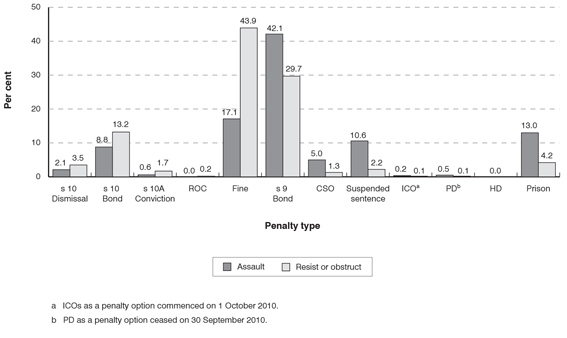
Outcomes within penalty types were also more severe for assaulting an officer than for resisting or obstructing an officer. Median terms of full-time imprisonment were longer (8 months full term and 5 months NPP/fixed term compared with 3 months full term and 3 months NPP/fixed term). The median fine was also higher ($500 compared with $400).
15. Drive without being licensed
Road Transport (Driver Licensing) Act 1998, s 25(1).
Maximum penalty: 20 pu.
Sentences
- fines (74.5%): the median fine was $400; the mode was $500 (18.3%); 66.7% of fines were in the middle 50% range of $200$500
- s 10 dismissals (15.3%)
- s 10 bonds (5.9%): the median duration was 12 months
- s 10A convictions (2.9%)
- s 9 bonds (1.3%): 7.4% were supervised; the median duration was 12 months
- CSOs (0.2%).
This offence had the fourth highest rate of s 10 dismissals in the list (up 4.4 pp from 2007 rates). Since 2007, the use of fines for this offence has reduced by 6.7 pp. However, the offence still had the second highest rate of fines in the list. There has been a corresponding increase in the use of s 10 dismissals (4.4 pp) and s 10 bonds (2.6 pp) since 2007. The median fine remains unchanged from 2007.
Licence disqualification
Only 13.0% of offenders were disqualified from holding a drivers licence (down 8.2 pp from 2007 and 16.0 pp from 2002). The median period of disqualification was 12 months and the mode was 3 years (34.3%). The next most common period of disqualification was 6 months (20.4%). These figures were similar to those observed in 2007.
16. Negligent driving (not causing death or GBH)
Road Transport (Safety and Traffic Management) Act 1999, s 42(1)(c).
Maximum penalty: 10 pu.
Sentences
- fines (76.9%): the median fine was $338;73 common fines were $500 (13.6%), $300 (12.4%) and $200 (12.2%); 50.4% of fines were in the middle 50% range of $250$450
- s 10 dismissals (17.3%)
- s 10A convictions (2.7%)
- s 10 bonds (2.5%): the median duration was 12 months
- s 9 bonds (0.4%) and CSOs (0.2%).
The sentencing patterns for this offence were very similar to those reported for drive without being licensed, although the median fine amount was lower. The patterns also closely resembled those observed in 2007. The offence attracted the highest rate of fines and third highest rate of s 10 dismissals of any offence in the list.
Licence disqualification
Only 4.0% of offenders were disqualified from holding a drivers licence. The median period of disqualification was 4 months and the mode was 3 months (40.0%). The next most common periods of disqualification were 6 months (29.2%) and 12 months (10.8%). This represents a slight reduction from figures recorded in 2007 and 2002 where 5.0% and 4.9% respectively of offenders who committed this offence had their licence disqualified and the median period of disqualification was 6 months.
17. Drive unregistered vehicle
Road Transport (Vehicle Registration) Act 1997, s 18(1).
Maximum penalty: 20 pu.
Sentences
- fines (65.9%): the median fine was $250; the mode was $200 (16.8%); 59.5% of fines were in the middle 50% range of $175$500
- s 10 dismissals (26.9%), s 10A convictions (6.6%), s 10 bonds (0.6%), s 9 bonds (0.1%) and CSOs (0.1%).
- This offence had the highest rate of s 10 dismissals and s 10A convictions of any offence in the list, but the lowest rate of s 10 bonds. Since 2007, the use of fines has declined by 12.3 pp, while there has been an increase in the use of s 10 dismissals (up 8.3 pp) and s 10A convictions (up 4.2 pp). The median fine has also decreased from both of the previous studies (down from $300).
Licence disqualification
Only 3 offenders were disqualified from holding a drivers licence (0.2%). In one case, the offender was disqualified for 12 months, and in the other two cases, for 24 months. These figures were similar to those observed in 2007.
18. Drive whilst suspended under s 66 of the Fines Act 1996
Road Transport (Driver Licensing) Act 1998, s 25A(3A)(a)(i).
Maximum penalty: 18 mths and/or 30 pu (first offence) [automatic licence disqualification 3 mths]; 2 yrs and/or 50 pu (second or subsequent offence) [automatic licence disqualification 2 yrs].
Sentences
- fines (51.0%): the median fine was $400; the mode was $500 (20.8%); 58.9% of fines were in the middle 50% range of $300$500
- s 10 dismissals (22.2%)
- s 10 bonds (21.9%): the median duration was 12 months
- s 9 bonds (2.8%): 9.5% were supervised; the median duration was 12 months
- s 10A convictions (1.8%), CSOs (0.2%) and suspended sentences (0.1%).
The diversion of the less serious offenders from drive whilst suspended to this offence provides a possible explanation for the apparent leniency in the sentencing for this offence compared with the drive whilst suspended offence.74 Despite the availability of custodial sentences for this offence, no offenders received a custodial sentence and only one received a suspended sentence. The offence had the second highest rate of s 10 dismissals and the fourth highest rate of s 10 bonds in the list.
Licence disqualification
Just over half of offenders (55.9%) were disqualified from holding a drivers licence. The median period of disqualification and the mode were both 3 months (84.7%).75 The next most common period of disqualification was 12 months (7.2%).
19. Goods in custody
Crimes Act 1900, s 527C(1).
Maximum penalty: 6 mths and/or 5 pu or both; 12 mths and/or 10 pu (where motor vehicle, vessel or part thereof).
Sentences
- fines (34.1%): the median fine was $400; the mode was $500 (26.1%); 66.7% of fines were in the middle 50% range of $250$500
- s 9 bonds (30.3%): 40.1% were supervised; the median duration was 12 months
- full-time imprisonment (16.5%): the median full term and NPP/fixed term were both 3 months
- s 10 bonds (6.9%): the median duration was 12 months
- suspended sentences (5.0%): 35.3% were supervised; the median term was 4 months
- CSOs (2.8%): the median term was 100 hours
- s 10 dismissals (2.2%); s 10A convictions (1.7%); PD (0.2%), HD (0.1%) and ROC (0.1%).
This offence attracted the highest rate of full-time imprisonment of all offences in the list, as was the case in 2007 (18.0%). However, the offence also had one of the lowest median full term and NPP/fixed term (unchanged from the previous studies). The median fine amount was also unchanged from the previous studies.
Despite the introduction of CINs for this offence, its ranking in 2010 was the same as in 2007. Further, sentencing patterns were unaffected for this offence in 2010 when compared with 2007.
20. Special-range PCA
Road Transport (Safety and Traffic Management) Act 1999, s 9(1).
Maximum penalty: 10 pu (first offence) [automatic licence disqualification 6 mths, minimum 3 mths]; 20 pu (second or subsequent offence) [automatic licence disqualification 12 mths, minimum 6 mths].
Sentences
- fines (69.8%): the median fine was $300; the mode was also $300 (21.4%); 57.9% of fines were in the middle 50% range of $250$450
- s 10 bonds (24.6%): the median duration was 12 months
- s 10 dismissals (3.9%); s 10A convictions (1.2%); s 9 bonds (0.6%).
This offence attracted the second highest rate of s 10 bonds and the fourth highest rate of fines of any offence in the list. Although this offence has the same maximum penalties and disqualification periods as low-range PCA, the penalties imposed for this offence were more severe than low-range PCA, with higher rates of fines and lower rates of s 10 bonds and s 10 dismissals. This offence did not appear in the 20 most common statutory offences list in 2002 or 2007.
Licence disqualification
Almost three-quarters of offenders (71.5%) were disqualified from holding a drivers licence. The median period of disqualification and the mode were both 3 months (55.6%).76 The next most common period of disqualification was 6 months (26.3%). Disqualification periods were very similar to low-range PCA.
Regulatory offences
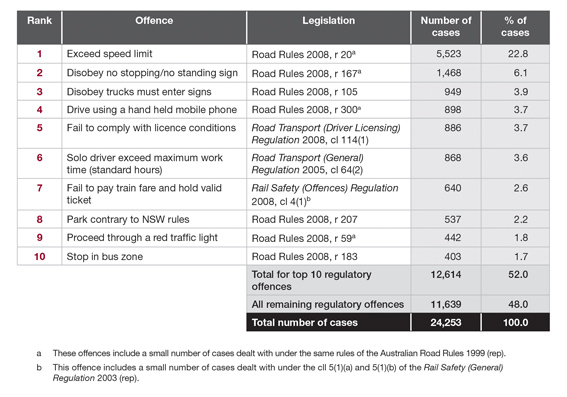
Table 3 shows the 10 most common regulatory offences (principal offences only) dealt with by the court in 2010.
Table 3: Most common regulatory offences (principal offence only) sentenced in the NSW Local Court in 2010
There were a number of amendments to the rules and regulations following the 2007 study, some of which are reflected in Table 3. For example, the Road Rules 2008 commenced operation in 2008 with the repeal of the Australian Road Rules 1999 without any substantial changes to the offences and penalties considered in the Trends.
The principal offence for 24,253 offenders sentenced in the court in 2010 was a regulatory offence. Regulatory offences accounted for 19.0% of all principal offences and the 10 most common regulatory offences accounted for 52.0% of the total number of regulatory offences (12,614 offenders). By comparison, in 2007, regulatory offences accounted for 18.8% of all principal offences (25,432 offenders), while the 10 most common regulatory offences accounted for 54.7% of the total number of regulatory offences (13,910 offenders).
The most common penalty for regulatory offences was a fine (69.6%), followed by s 10 dismissals (26.1%). The median fine was $200 and the mode was $200 (11.7%). Fines of $100 were also common (10.2%), and 52.6% of fines were in the middle 50% range of $150 to $338. These figures were very similar to those observed in 2007.
The majority of offenders (92.2%) who committed regulatory offences were sentenced for traffic and vehicle regulatory offences, accounting for 22,362 offenders. The most common regulatory offence was for exceed speed limit under r 20 of the Road Rules 2008 (22.8%), accounting for 5,523 offenders. This offence was more common than the fifth most common statutory offence of drive whilst disqualified. The offence of exceed speed limit was also the most common regulatory offence in 2007, accounting for 26.0% of all regulatory offences. The next most common regulatory offence was disobey no stopping/no standing sign (6.1% in 2010 down from 6.9% in 2007). This offence accounted for 1,468 offenders making it more common than the 18th most common statutory offence drive whilst licence suspended under s 66 of the Fines Act 1996.
The distribution of the 10 most common regulatory offences (principal offences only) differed greatly from that observed in 2007. The two most common offences were the same for 2007 and 2010 (exceed speed limit and disobey no stopping/no standing sign). However, five new offences appear in the list for 2010.77 There were minor changes in the rankings for those offences remaining on the list, with the exception of failure to pay train fare and hold valid ticket which fell from third in 2007 to seventh in 2010 (with a 41.3% decrease since 2007).78 The frequency of the offence of disobey trucks must enter sign increased significantly from 2007 to 2010. In 2010, this offence was ranked third with 949 cases, while in 2007 it was not included in the 10 most common regulatory offences list (only 49 cases).79
Conclusion
The overall distribution of the 20 most common statutory principal offences in the court in 2010 was similar to that observed in 2007 and 2002. Points of similarity include:
- Seventeen of the offences appearing in the 2010 list also appeared in the 2007 list, while 16 were in the 2002 list.
- Six of the offences held the same rankings as they did in 2007, and two offences had the same rankings in 2002. The two most common offences (mid-range PCA followed by common assault) were the same as in 2007 and 2002, and the third ranked offence (low range PCA) has not changed from 2007.
- Four of the five most common offences in 2007 remained in the five most common offences for 2010. Three of these offences were also in the five most common offences for 2002.
- Around half of the 20 most common statutory offences in the 2010 list related to the use and operation of a motor vehicle as was the case in 2002 and 2007.
There were some noticeable changes in the offences appearing in the 2010 list. Three new offences appeared in the list: stalk or intimidate with intent to cause fear of physical or mental harm, drive whilst licence suspended under s 66 of the Fines Act 1996 and special-range PCA.
Differences in the rankings of offences between 2002, 2007 and 2010 include:
- Larceny fell from third ranking on the list in 2002 and fifth in 2007 to 10th on the list in 2010.
- Knowingly contravene AVO moved up from 13th in 2007 to eighth in 2010.
- Two Summary Offences Act 1988 offences, offensive conduct and offensive language, did not appear on the list at all in 2010.
The movements in the offence rankings were likely to have been affected by a number of factors, for example, the introduction of CINs, the creation of a new offence (drive whilst licence suspended under s 66 of the Fines Act1996), and the changed method of selecting the principal offence.80 Some changes may have been affected by an accumulation of any of these factors.
Despite the introduction of ICOs and the removal of PD as a penalty option in the last quarter of 2010, the overall distribution of penalty types remained similar to those reported in 2007 and 2002. Notable patterns include:
- Fines continued to be the most common penalty imposed by the court for statutory offences, with 43.7% of offenders receiving a fine. Fines were even more common when regulatory offences were taken into account (48.6%).81
- The next most common penalties were s 9 bonds (19.8%). It is interesting to note that in the small number of cases (5.29%) where a fine was imposed in addition to other penalties, 91.09% were imposed in addition to a s 9 bond.
- The third most common penalties were dismissals and discharges without conviction under s 10 (18.6%). Of the offences attracting these penalties, 12.5% were conditionally discharged on a bond and 6.1% had their charge dismissed unconditionally.
- Two penalty types accounted for the overwhelming majority of regulatory offences: fines, which were imposed in 69.6% of cases, and s 10 dismissals, which were imposed in 26.1% of cases.
The following shows the differences in sentencing patterns between 2002, 2007 and 2010. While some of the percentage changes may appear small, they account for a large number of individual cases dealt with by the court:
- A decrease in the use of fines from 50.2% (2002), 48.2% (2007) to 43.7% (2010). The median fine, however, increased from $400 in previous studies to $500 in 2010.
- An increase in the use of s 9 bonds from 14.5% (2002), 18.0% (2007) to 19.8% (2010), and in the use of s 10 bonds from 10.4% (2002), 10.5% (2007) to 12.5% (2010).
- A gradual increase in the use of suspended sentences from 4.0% (2002), 4.4% (2007) to 4.8% (2010).
- A gradual decrease in the use of CSOs from 4.5% (2002), 4.2% (2007) to 3.9% (2010). However, the median term of CSOs increased from 100 hours (2002 and 2007) to 120 hours (2010).
- A doubling of s 10A convictions from 0.8% (2007) to 1.7% (2010).
- While there has been little difference in the imposition of custodial penalties, there has been a noticeable increase in the duration of terms. The median term of full-time imprisonment increased from 6 months (2002), 8 months (2007) to 9 months (2010). The median term of PD also increased from 6 months (2002), 8 months (2007) to 9 months (2010).
The sentencing patterns reveal a high rate of non-custodial sentences among the 20 most common statutory offences. Other sentencing patterns observed in the list include:
- The offence of drive whilst disqualified had the highest rate of custodial sentences (17.6%), followed by assault occasioning actual bodily harm and goods in custody (16.8% each).
- The offence of goods in custody received the highest rate of full-time imprisonment in the list (16.5%), followed by assault occasioning actual bodily harm (15.9%) and larceny (15.0%). The longest median term of full-time imprisonment was imposed for assault occasioning actual bodily harm (full term: 12 months; NPP/fixed term: 6 months).
- The offences of stalk or intimidate with intent to cause fear of physical or mental harm, assault occasioning actual bodily harm and common assault received the highest rates of s 9 bonds (52.7%, 46.1%, and 40.0% respectively). The longest median duration of a s 9 bond was 18 months imposed for drive whilst disqualified and high-range PCA.
- The three offences with the highest rates of fines were negligent driving (not causing death or GBH), drive without being licensed and never licenced person drive on road (76.9%, 74.5% and 71.3% respectively). The highest median fine imposed was $1000 for high-range PCA. The next highest median fines were imposed for drive whilst disqualified ($750), mid-range PCA ($700) and assault occasioning actual bodily harm ($700).
- Although imprisonment was available, a custodial sentence or a suspended sentence was rarely imposed for drive whilst suspended under s 66 of the Fines Act 1966 (0.1%), never licenced person drive on road (0.6%), drive whilst suspended (1.9%), possess prohibited drug (2.1%) and mid-range PCA (2.3%).
Despite the introduction of new offences, the change in charging procedures with the introduction of CINs and changes in penalty options, the 20 most common statutory offences and the overall sentencing patterns have remained relatively stable since 2002.
Appendix A: Proven offences in the NSW Local Court in 2010 by ANZOC division and subdivision
Appendix B: Distribution of penalty types for proven offences (principal offence only) in the NSW Local Court in 2010
Endnotes
1 See J Keane and P Poletti, Common offences in the Local Court, Sentencing Trends & Issues, No 28, Judicial Commission of NSW, 2003 (2002 study); M Karpin and P Poletti, Common offences in the NSW Local Court: 2007,Sentencing Trends & Issues, No 37, Judicial Commission of NSW, 2008 (2007 study).
2 Australian Bureau of Statistics, Australian and New Zealand Standard Offence Classification (ANZSOC), 2011, 3rd edn, cat no 1234.0, ABS, Canberra. Only the title was changed and some minor typographical errors corrected from the 2nd edn, published in 2008 (Australian Standard Offence Classification (ASOC)). The classification content and structure remained unchanged.
3 For example, sentences imposed for breaches of suspended sentences, community service orders (CSOs) and good behaviour bonds have been excluded on the basis that they arise under breach provisions that provide for a call-up procedure which may culminate in offenders being re-sentenced for the original offences. Hence, these are not regarded as offences in the strict sense.
4 If two or more offences received identical penalties, the offence with the highest Median Sentencing Ranking (MSR) is selected as the principal offence. The MSR is a measure of offence seriousness in NSW, jointly developed by BOCSAR and the Judicial Commission of NSW. See I MacKinnell, P Poletti and M Holmes, Measuring offence seriousness, No 142, BOCSAR, 2010. The MSR was not used to select the principal offences in the earlier studies and its use in the Trends may have had an impact on the rankings for some offences.
5 As to the meaning of second or subsequent offence for particular driving offences, see the definitions in the Road Transport (General) Act 2005, ss 3 (major offence), 188(1) (convicted person); Road Transport (Safety and Traffic Management) Act 1999, Dictionary, cl 1, 2(1); Road Transport (Driver Licensing) Act 1998, ss 25(5), 25A(11).
6 One penalty unit is currently equivalent to $110: Crimes (Sentencing Procedure) Act 1999, s 17.
7 This figure includes 2081 companies (1.6%).
8 An analysis of offences using ANZSOC was not undertaken in the 2002 or 2007 studies.
9 With the exception of figures for court location and number of offences, the following figures exclude the 2,081 companies. Analysis of offender characteristics was not undertaken in the 2002 and 2007 studies.
10 The gender was unknown in, 380 cases (1.1%). Accordingly, these figures are based on 124,486 individual offenders.
11 The age was unknown in 2,506 cases (2.0%). Accordingly, these figures are based on 123,360 individual offenders.
12 This figure includes only those offenders identified as Indigenous. The Indigenous status of offenders was unknown in 40,329 cases (32.0%).
13 One offender was sentenced for 204 offences. Fourteen of those offences, including the principal offence, were having false instruments with intent to use contrary to the Crimes Act, s 302 (rep). The remaining offences were for obtaining money etc by deception contrary to the Crimes Act, s 178BA(1) (rep).
14 The Local Court data from BOCSAR are sourced from the JusticeLink system, which was introduced in the second half of 2009. Due to less accurate recording of pleas for 20092010 (see NSW Bureau of Crime Statistics and Research, New South Wales Criminal Courts Statistics 20092010, 20102011, BOCSAR, Sydney, p iii), the guilty plea figure for 2010 has been derived by averaging the figures from 2006 (73.8%), 2007 (76.1%) and 2008 (76.6%).
15 A prior offence is of the same type if the principal offence and prior offence were within the same ANZSOC division. Where offenders had both prior offences of the same type and of a different type, these offenders have been included with the offenders with priors of the same type.
16 The prior record was unknown in 4,150 cases (3.3%). Accordingly, these figures are based on 121,716 individual offenders.
17 These cases include those where proceedings were commenced by way of a penalty infringement notice or where the court dispensed with bail.
18 This group consists of persons on remand (bail refused) (4.9%) and persons in custody serving a sentence for a prior offence (1.3%).
19 The bail status was unknown in 626 cases (0.5%). Accordingly, these figures are based on 125,240 individual offenders.
20 Sections 6, 7 and 260.
21 R v El Masri [2005] NSWCCA 167 at [30].
22 ibid at [30].
23 (2000) 50 NSWLR 115.
24 ibid at [35].
25 Crimes (Sentencing Legislation) Amendment (Intensive Correction Orders) Act 2010, Sch 1[6].
26 ibid, Sch 1[8].
27 ibid, Sch 1[7].
28 The cases reflect those on JIRS, with 110 offenders being excluded because the penalty imposed was contrary to law (30 cases), or the law part code used to record the offence was invalid (80 cases). The law part code is a unique code assigned by the Judicial Commission which identifies and describes specific offences within provisions of legislation.
29 Fines can also be imposed with other penalties considered to be higher in the sentencing hierarchy (primary penalties). As this analysis only encompasses primary penalties, this figure does not include fines imposed in addition to other penalties (secondary penalties). In 2010, there were 5,415 fines imposed in addition to the primary penalty (5.2% of the total number of offenders sentenced). Of these, the vast majority were imposed in addition to a s 9 bond (91.0%). As a secondary penalty, the median fine was $600, higher than for fines imposed as the only penalty. The most common fine amounts were $500 and $1,000 imposed on 20.1% and 14.1% of offenders respectively.
30 This figure includes 0.7% of offenders ordered to enter a recognizance under the Crimes Act 1914 (Cth), s 20(1)(a). In 24.0% of cases where a s 9 bond was imposed, a fine was also imposed.
31 The mandatory licence disqualification provisions in ss 188(2) and (3) of the Road Transport (General) Act 2005 have no application where a s 10 order is made for a driving offence, as s 188 requires a conviction of the convicted person: s 188(1).
32 This figure includes 0.3% of offenders who were discharged without proceeding to conviction under the Crimes Act 1914, s 19B.
33 Crimes (Sentencing Procedure) Act, s 10(1)(a).
34 Section 10 bonds include offenders discharged on a good behaviour bond: s 10(1)(b); and offenders discharged to participate in an intervention program: s 10(1)(c). Only a few offenders received the latter penalty.
35 A fine was also imposed on 0.1% of offenders who received a sentence of full-time imprisonment.
36 A court may not set a non-parole period for a sentence of imprisonment if the term of the sentence is 6 months or less: Crimes (Sentencing Procedure) Act, s 46. A court may decline to set a non-parole period if it appears appropriate to so do: s 45(1).
37 The balance of the term of the sentence must not exceed one-third of the non-parole period of the sentence (or put another way, the non-parole period must not be less than three-quarters of the full term of sentence) unless the court decides that there are special circumstances for it being more: Crimes (Sentencing Procedure) Act, s 44(2).
38 Under the Crimes (Sentencing Procedure) Act, s 12(1)(b), an offender is released from custody on condition that he or she enters into a good behaviour bond for a term not exceeding the term of the sentence. This figure includes 0.2% of offenders who were released forthwith on recognizance under the Crimes Act 1914, s 20(1)(b).
39 A fine was also imposed on 4.1% of offenders in respect of whom a CSO was made.
40 Crimes and Courts Legislation Amendment Act 2006, Sch 1.9[1].
41 A fine was also imposed on 1.6% of offenders who were sentenced to periodic detention (PD).
42 For a more comprehensive analysis of PD, see NSW Sentencing Council, Review of Periodic Detention, Report, NSW Sentencing Council, December 2007.
43 A fine was also imposed on one offender sentenced to home detention (HD) (0.6%).
44 The principal focus of an intensive correction order (ICO) is rehabilitation. An ICO should not be used as a substitute for the discontinued sentencing option of PD: R v Boughen [2012] NSWCCA 17 at [109][110].
45 This offence includes a small number of cases dealt with under repealed provisions. Section 13(1) of the Crimes (Domestic and Personal Violence) Act 2007, which commenced on 10 March 2008, substantially re-enacted theCrimes Act 1900, 545AB(1) (rep). That section commenced on 12 March 2007, and in turn substantially re-enacted s 562AB(1) (rep).
46 PCA refers to prescribed concentration of alcohol.
47 Fines Further Amendment Act 2008, Sch 2.3 (commenced on 9 March 2009).
48 Second Reading Speech, Fines Further Amendment Bill 2008, NSW, Legislative Council, Debates, 27 November 2008, p 11,973.
49 Criminal Procedure Further Amendment (Penalty Notices) Regulation 2007 (commenced on 1 November 2007). The trial commenced in September 2002: Crimes Legislation (Penalty Notice Offences) Act 2002.
50 The penalty lengths for penalty types accounting for less than 0.05% of penalties have not been shown.
51 Automatic disqualification occurs where an offender is convicted of a particular driving offence and is disqualified by the conviction without specific order of a court.
52 The period of disqualification was not known in 91 cases (1.1%).
53 The jurisdictional maximum for this offence was increased to 2 yrs and/or 50 pu: Courts and Crimes Legislation Amendment Act 2012, Sch 1.1 (commenced on 21 March 2012). The amendment applies to offences committed on or after 21 March 2012, which is outside the scope of the Trends.
54 The period of disqualification was not known in 45 cases (1.2%).
55 Where the type of drug was known; the type of drug was unknown in 100 cases (1.5%).
56 Driving offences with the same maximum penalty (although licence disqualification periods differ) include high-range PCA, drive whilst suspended and drive whilst suspended under s 66 of the Fines Act 1996.
57 The period of disqualification was not known in 162 cases (3.3%).
58 See discussion on p 8.
59 See item 18 below.
60 The period of disqualification was not known in 55 cases (2.0%).
61 This offence includes a small number of cases dealt with under repealed provisions. Section 14(1) of the Crimes (Domestic and Personal Violence) Act 2007, which commenced on 10 March 2008, substantially re-enacted theCrimes Act 1900, s 562ZG(1) (rep). That section commenced on 12 March 2007, and in turn substantially re-enacted s 562I(1) (rep).
62 The Crimes Amendment Act 2007 replaced the term maliciously with intentionally or recklessly for offences in the Crimes Act 1900 (effective 15 February 2008). The offence of destroy or damage property is substantively the same as the offence titled maliciously destroy or damage property in the 2002 and 2007 studies.
63 The jurisdictional maximum for this offence was increased to 2 yrs and/or 20 pu: Courts and Crimes Legislation Amendment Act 2012, Sch 1.1 (commenced on 12 March 2012). The amendment applies to offences committed on or after 21 March 2012, which is outside the scope of the Trends.
64 The jurisdictional maximum for this offence was increased to 2 yrs and/or 50 pu: Courts and Crimes Legislation Amendment Act 2012, Sch 1.1 (commenced on 12 March 2012). The amendment applies to offences committed on or after 21 March 2012, which is outside the scope of the Trends.
65 Where the value of property was known. The property value was not known in over one-third of offences (39.9%). The sentencing patterns for this group, however, closely resemble those where the value of property did not exceed $2,000.
66 See above n 63.
67 See above n 64.
68 See discussion on p 8.
69 Where the value of property was known. The property value was not known in 32.0% (up from 18.5% in 2007) of larceny offences. The sentencing patterns for this group, however, closely resemble those where the value of property did not exceed $2,000.
70 No comparison has been made with the 2002 study given the effect of Re Attorney Generals Application under Section 37 of the Crimes (Sentencing Procedure) Act 1999 (NSW) (No 3 of 2002) (2004) 61 NSWLR 305 (the high-range PCA guideline judgment). See the 2007 study, above n 1, pp 1314.
71 The period of disqualification was not known in 62 cases (1.8%).
72 This offence includes a small number of cases dealt with under repealed provisions. Section 13(1) of the Crimes (Domestic and Personal Violence) Act 2007, which commenced on 10 March 2008, substantially re-enacted theCrimes Act 1900, 545AB(1) (rep). That section commenced on 12 March 2007, and in turn substantially re-enacted s 562AB(1) (rep).
73 This is the same amount as the penalty infringement notice at the time. Around one in 10 fines (10.4%) were for this amount.
74 See discussion on p 8.
75 The period of disqualification was not known in 33 cases (4.0%).
76 The period of disqualification was not known in 12 cases (1.4%).
77 Disobey trucks must enter signs: Road Rules 2008, r 105; solo driver exceed maximum work time (standard hours): Road Transport (General) Regulation 2005, r 64(2); park contrary to NSW rule: Road Rules 2008, r 207; and proceed through a red traffic light: Road Rules 2008, r 59.
78 In the 2007 study, the cases under cll 5(1)(a) and 5(1)(b) of Rail Safety (General) Regulation 2003 (rep) were assigned separate law part codes and were analysed as separate offences. If these had been regarded as one offence, the ranking for the offence in 2007 was third rather than fourth (1091 cases). For the purpose of comparison with the current offence under cl 4(1) of the Rail Safety (Offences) Regulation 2008, this ranking has been used.
79 There were no offenders sentenced for this offence in 2005, 9 in 2006, 1,129 in 2008, and 1,202 in 2009.
80 See above n 4.
81 See Appendix B.